
The Illusion of the ‘Near’
THE ILLUSION EFFECTS OF ‘NEAR-TERM’ PRICES
By G. R. Harrison (2014)
Click on chart to enlarge for clarity
As usual (and to be expected in a such a negative-news environment), most of the public expect calamity.
The more experienced few see a Bull Market like that of the 1990’s taking place in front of our eyes.
As those of you who have followed my posts over the last year or so know, I’ve been voting on the latter scenario for quite some time.
Most cannot see it and have been blinded by their emotions.
Let’s look at the facts, instead . . .
Two important and required parts for a Stock Market Boom are already in place.
- The majority of the public is out of the stock market; content to be watching & waiting for disaster to befall the Rich that are in the stock market heavily. They will be brought back into the markets when the ‘smart’ money is ready to sell off their vast inventories.
- War drums and a ‘weak’ economy (as perceived by the public trader again) seem to offer a reason for caution and even danger to the small investor.
But, of course, like all the other times in market History, these ‘reasons’ end up not being reasons at all and only serve to keep millions from participating in the early and most profitable stage of a Bull Market.
Click on chart to enlarge for clarity
The problem is also attributable to a Human perception flaw.
Human Beings tend to exaggerate the importance of objects (or in this case prices) that are nearest to them in Space and Time.
We’re right Here; Now and ‘Near’ to today’s price action as well as the last week’s. It looms large on our screens that are easily available and staring at us as charts on websites and the media.
Because we’re so ‘Near’, every price movement and swing seems exaggerated and important especially when combined with news designed to swing our emotions.
As far as TIME is concerned, it’s like we’re looking through a magnifying glass at a tiny portion of the ‘whole market’ and making judgments based on what we ‘see’. Therefore, it becomes plain that we’re not viewing the market accurately by limiting ourselves to only a portion of the total Time of a price movement.
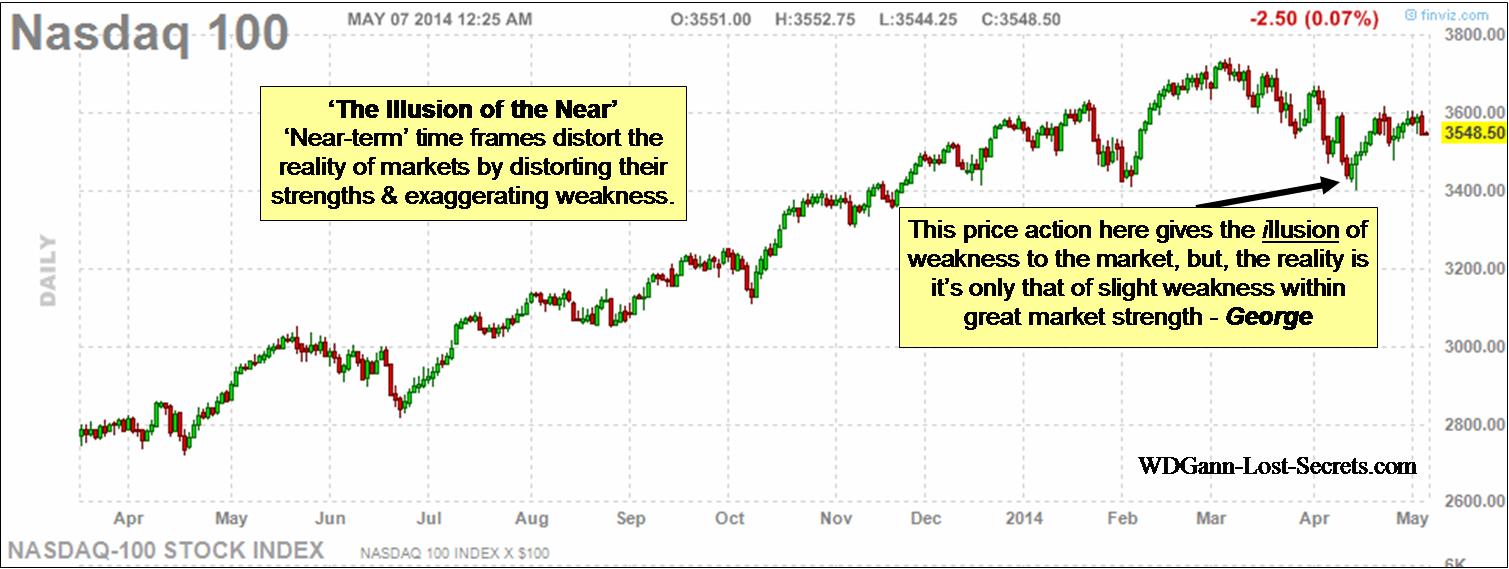
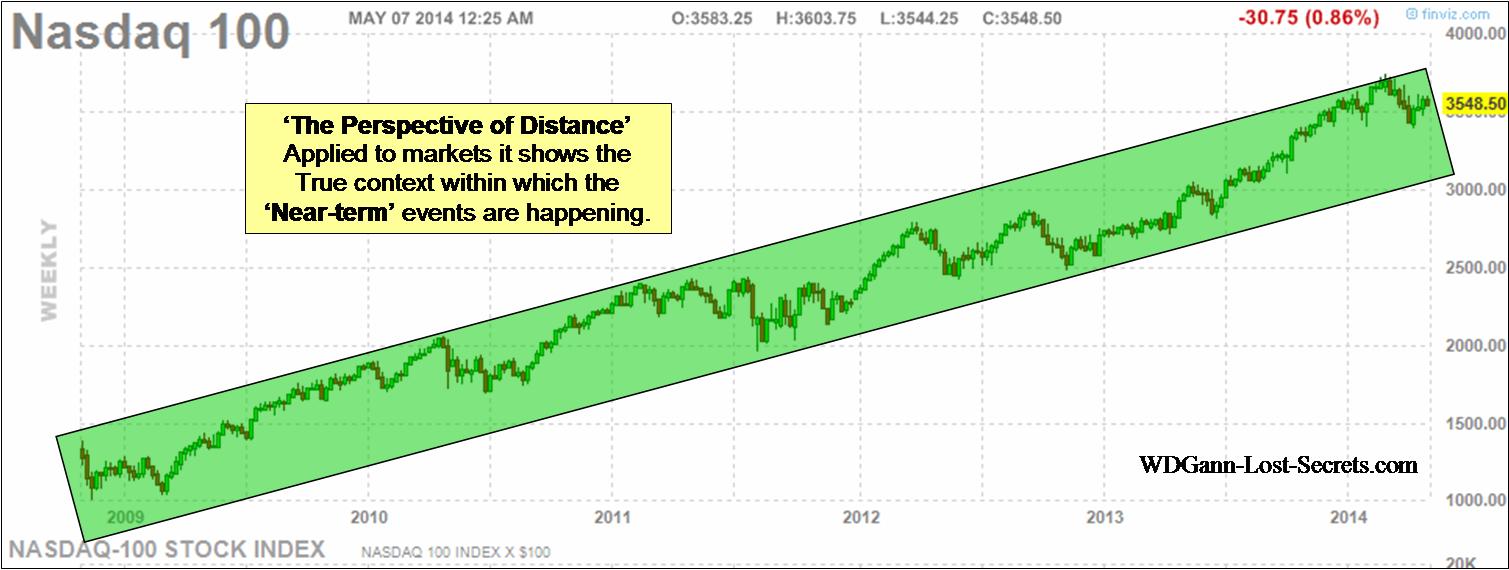
Observe the two charts for the NASDAQ 100 shown above.
As you can see, the ‘Near’ chart (the first one on this page with the shortest time-frame) ‘looks’ like the beginnings of a Crash or at least, seems to show a very weak market.
However, by looking at the second and much longer term chart, I hope you’ll see that, for the very same Nasdaq 100 market going back YEARS instead of days, we find that today’s ‘Near-term’ charts are only reflecting normal fluctuations and will fit nicely into the second chart’s green rectangle containing all the price action for the last 5-YEARS.
The Market will eventually react and come down again, but, we need to judge that moment (and the warning that it’s coming) by a more distant template than just today’s ‘Near-term’ magnifying glass!
This stepping back is necessary in order not to be scared out of markets or pushed into others prematurely. Please consider it as one of your tools for evaluation.
This same process applies to other markets (excepting commodities because of their annual seasonal nature). – GR HARRISON
![]()
THE EXCALIBUR TRADING METHOD

CLICK HERE TO LEARN MORE
![]()
The rediscovery of these WD Gann lost secrets (and many more) as well as other completely original discoveries are available to a limited number of students each year through The Harrison-Gann Trade Secrets Master Course. Contact me by e-mail for price and availability by clicking the box below.

![]()
If you’re an active trader, you’ll probably be interested in also visiting my other website called www.money-tigers.com where you’ll find that I predicted these lower Gold prices some time ago using other techniques (like the Excalibur Method). Note that there are over 4-years of archived posts there with many, many spot-on predictions.
I’d like to point out that this is a tribute to technique rather than ego and that the techniques applied were developed from my many decades of research into Gann materials and personal research derived or inspired by Mr. Gann’s work. – George
DISCLAIMER AND RISK DISCLOSURE
The content on this site and articles are provided as general information only and should not be taken as investment advice. All information on this site is given for educational purposes only.
The content on this site is provided without any warranty, express or implied. All opinions expressed on this site are those of the author and may contain errors or omissions.
NO MATERIAL HERE CONSTITUTES “INVESTMENT ADVICE” NOR IS IT A RECOMMENDATION TO BUY OR SELL ANY FINANCIAL INSTRUMENT, INCLUDING BUT NOT LIMITED TO STOCKS, BINARY OPTIONS, OPTIONS, FOREX, BONDS OR FUTURES.
WD Gann Lost Secrets.com & GR Harrison © 2013
U.S. Government Required Disclaimer – Commodity Futures Trading Commission Futures, Currency and Options trading has large potential rewards, but also large potential risk. You must be aware of the risks and be willing to accept them in order to invest in the futures and options markets. Don’t trade with money you can’t afford to lose. This is neither a solicitation nor an offer to Buy/Sell futures or options. No representation is being made that any account will or is likely to achieve profits or losses similar to those discussed on this web site. The past performance of any trading system or methodology is not necessarily indicative of future results.
CFTC RULE 4.41 – HYPOTHETICAL OR SIMULATED PERFORMANCE RESULTS HAVE CERTAIN LIMITATIONS. UNLIKE AN ACTUAL PERFORMANCE RECORD, SIMULATED RESULTS DO NOT REPRESENT ACTUAL TRADING. ALSO, SINCE THE TRADES HAVE NOT BEEN EXECUTED, THE RESULTS MAY HAVE UNDER-OR-OVER COMPENSATED FOR THE IMPACT, IF ANY, OF CERTAIN MARKET FACTORS, SUCH AS LACK OF LIQUIDITY. SIMULATED TRADING PROGRAMS IN GENERAL ARE ALSO SUBJECT TO THE FACT THAT THEY ARE DESIGNED WITH THE BENEFIT OF HINDSIGHT. NO REPRESENTATION IS BEING MADE THAT ANY ACCOUNT WILL OR IS LIKELY TO ACHIEVE PROFIT OR LOSSES SIMILAR TO THOSE SHOWN.
All information on this website or any manual, course, module, e-book or software purchased from this website is for educational purposes only and is not intended to provide financial advise. Any statements about profits or income, expressed or implied, does not represent a guarantee. Your actual trading may result in losses as no trading system is guaranteed. You accept full responsibilities for your actions, trades, profit or loss, and agree to hold www.money-tigers.com, the money tiger’s group and any authorized distributors of this information harmless in any and all ways. Any data and information is provided ‘as is’ solely for informational purposes, and is not intended for trading purposes or advice.