George Harrison
Author Archives: George Harrison

GBP/JPY: Getting Ready for the Next Downswing


FOREX TRADERS:

The GBP/JPY: Getting Ready for the Next Downswing

gbp-jpy

Click Chart to Enlarge

The Longer-Term Trend for the GBP/JPY is solidly DOWN now and, this trend will probably hold for many months if not years to come.

These are exactly the type of situations that WD Gann used to write about taking advantage of.

Markets decline much faster than they rise, and so, provide an excellent opportunity for faster and more profitable trades once we get on the right side of the trend at the right moment.

With this firmly in mind, we should then scout out the prime points to establish SELLING positions with the least amount of risk possible.

gbp-jpy2

Click Chart to Enlarge

Timing for the next day or two is the focal point as we’re presently in a rally.

This uptrend, barring any new price momentum, should end by Friday or Sunday.

When it does, it will have to trigger the present price break point of 157.00.

That will be the confirmation signal for the next downswing in prices.

Note, as always that this is purely an educational exercise and not an advisory or solicitation to buy or sell. Read our extensive disclaimers to this effect.

Observe and learn what is possible with the proper educational tools.

Contact me HERE when you’re ready move up and obtain these World-Class, Premium Tools to apply to your own portfolio. – George

————————————————————————————————————


Where’s the Money Made in the Markets These Days?


A Pause In Trend: Where is the Money Being Made?

As shown in the last post, we have to drill down to intra-day time frames to find a price trend in the Stock Market. That hourly trend ended almost as soon as it was posted.

When one does locate a short-term trend, you can be almost certain that it will be a short-lived affair with a reversal that will backtrack over the same gains that were accumulated earlier.

Because most Human Beings are longer-term oriented, they’ll largely hold on too long to a position expecting (hoping) that a longer-trend will kick in and save their position.

It almost never does.

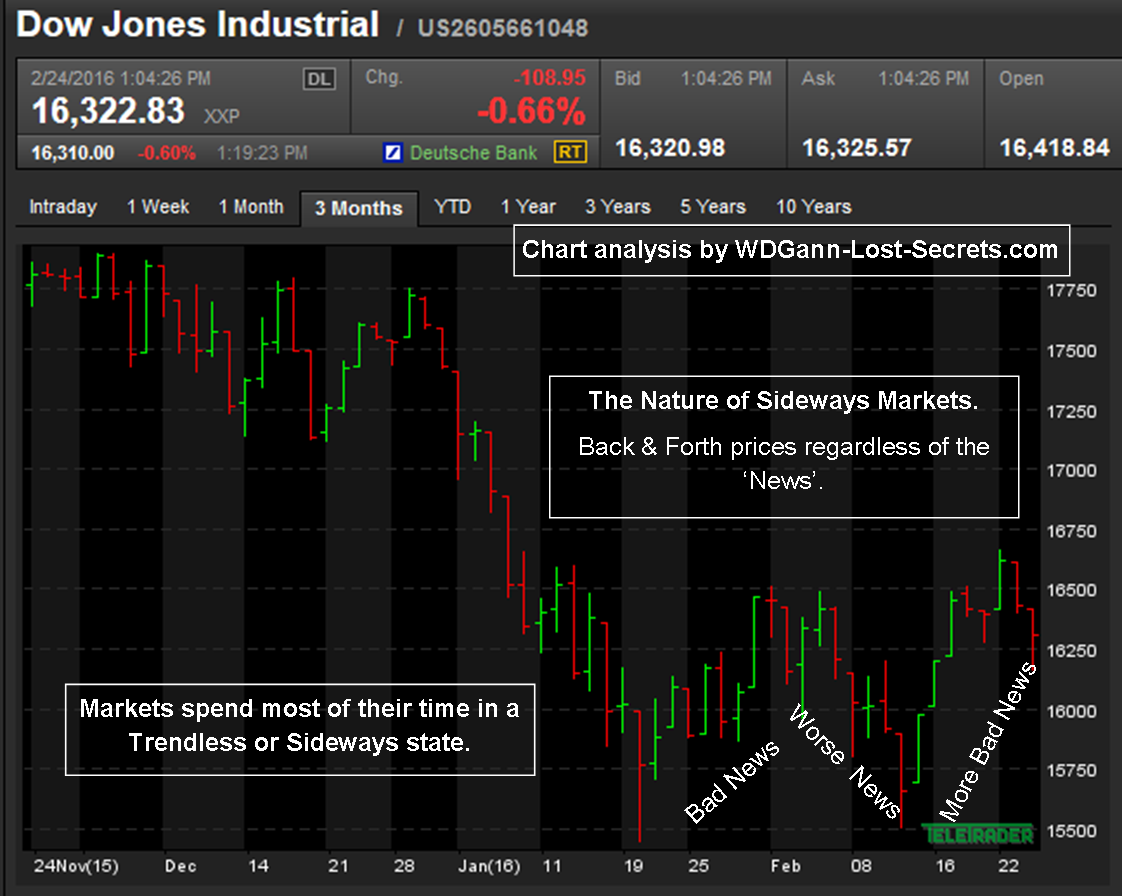
The Stock Market indexes are a good example of this process. The Market is at a critical turning point on the Long-term Monthly basis.

It’s literally resting upon a set of lows that have been defined over Time and Price Momentum, so, a significant pull-back at this point will endanger a trend that goes back years in time.

Will Stocks tip over the edge?

dowtrendless3A factor working against a real crash is the expectation of almost everyone that one is coming or here.

Sorry, but that’s not the way to bet when it comes to the majority of investors being right.

Nature pretty much guarantees that that won’t happen too often.

Those who foretold the the Great Stock Crash of 1929 are famous today because they were so few in number.

The masses of investors just never see it coming, so, there’s some comfort to draw today as literally everyone believes a crash is imminent.

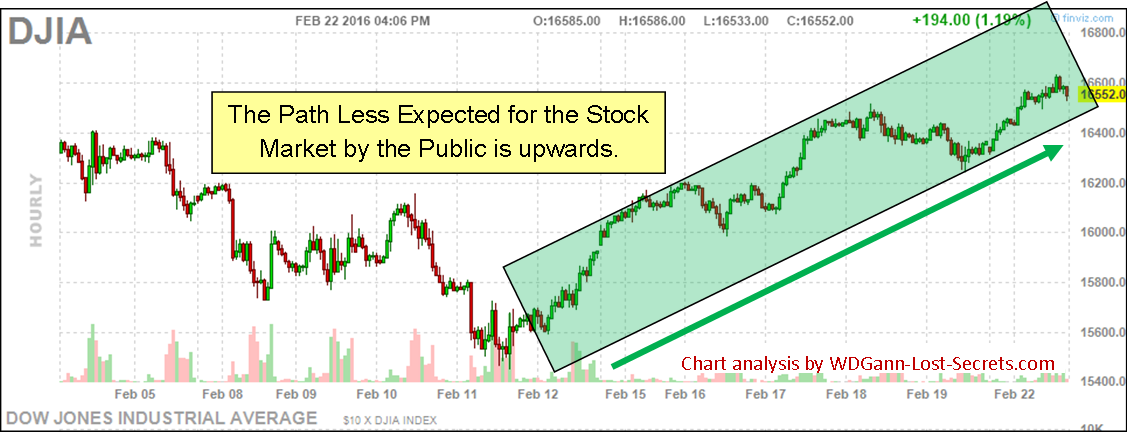
There are some ignored fundamentals that can back up a higher market, so, this bears watching using our indicators, although, ‘News’ is hardly the deciding factor when it comes to making money from the markets; especially at times like this.

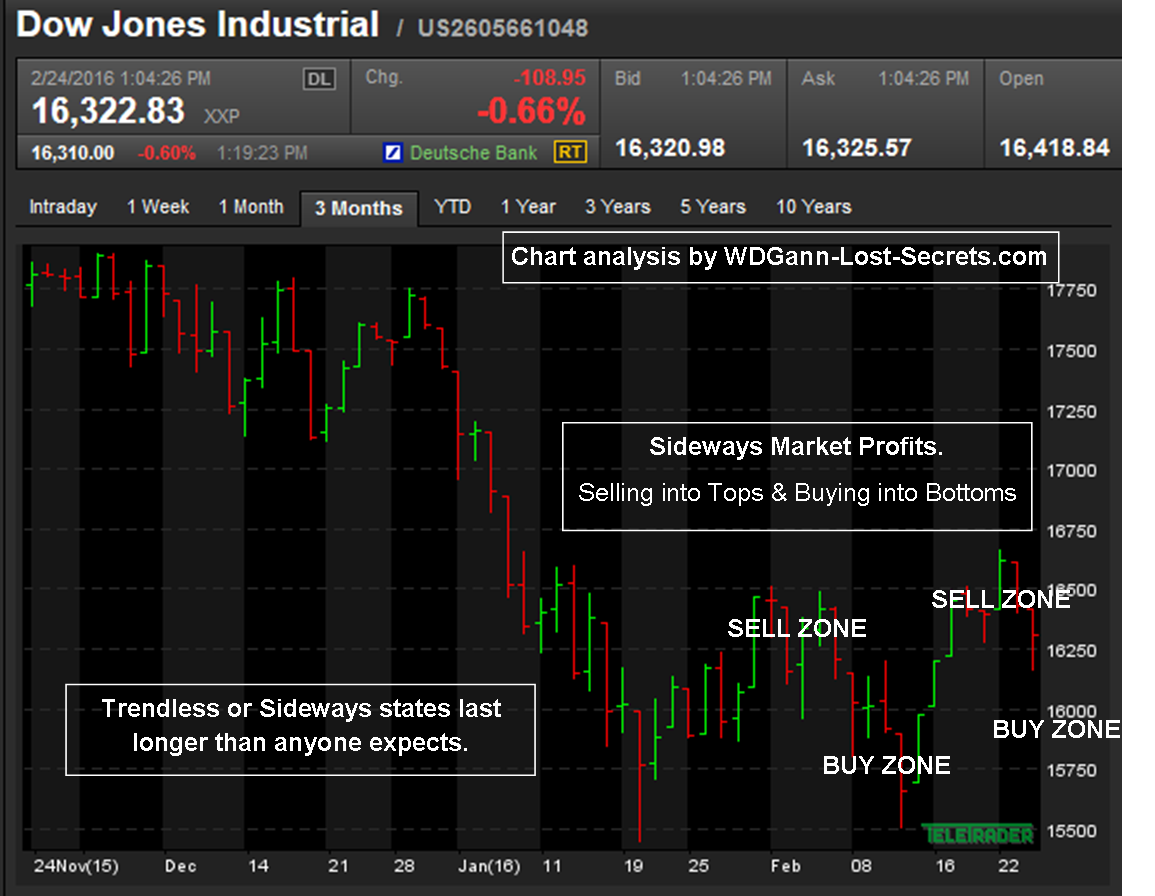
Note on the chart. ‘Bad News’ or ‘Worse News’ seem to be the only choices offered to investors and traders today. But, is that an accurate portrayal of the real opportunities out there?

It is most assuredly not.

dowtrendless2
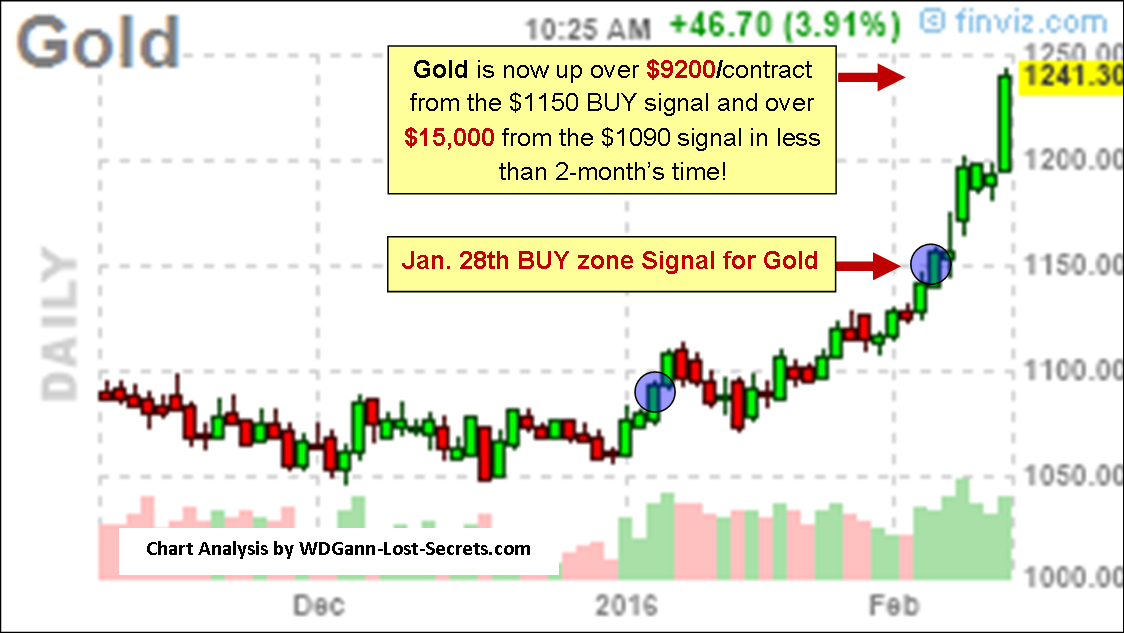
There’s a particular group of quiet investors who are ‘cleaning up’ while everyone else is wringing their hands in grief and worry.

Who are they and just what are they doing that so many others are not?

They are the ‘Counter-Trend Traders’ who, for lack of a better description, are working with the trend-less aspects of the Market by trading against the recurring Tops and Bottoms.

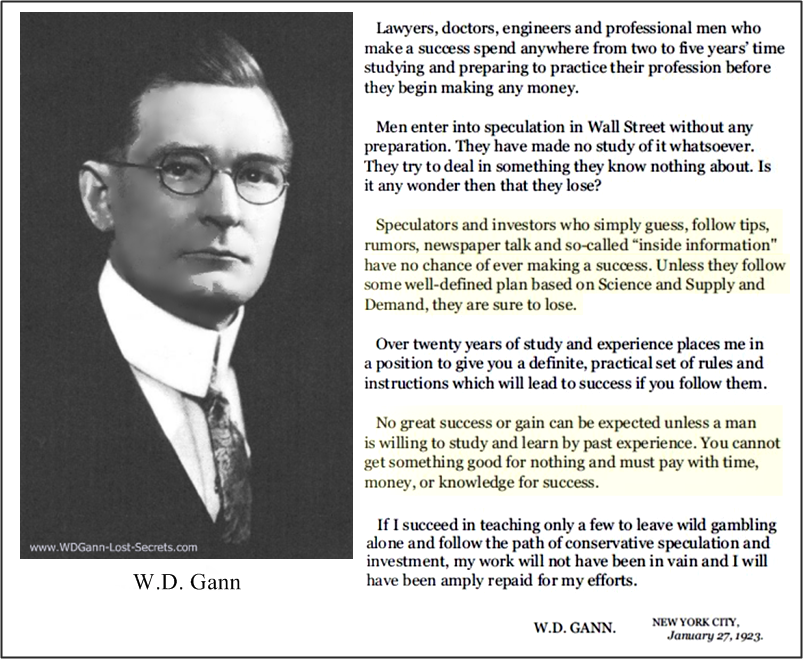
This approach requires a disciplined mindset and is one that W.D. Gann was expert in applying in his days as a floor trader on the Exchange. Most assume that Mr. Gann only traded long-term, however, during his brokerage days and as a member of the Exchange he achieved a remarkable 90% plus success rate with short-term trades conducted daily.

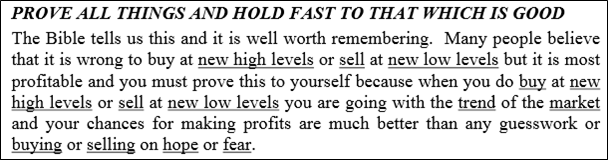
To do that successfully in non-trending markets required the skill of trading against the crowd and Selling Tops and Buying Bottoms. Most of the techniques for doing this consistently require one to always go against their natural instincts by Selling into a buying frenzy and Buying into a selling panic.

One must have the skill sets to locate where those critical price points are located of course (you can find out how in our ‘Excalibur II: Mastering Sideways Markets’ technique; part of The Harrison-Gann Master Course). Good Trading. – George


Stock Market Trends: The Path Least Expected


Stock Market Trends: The Path Least Expected

Can a Stock Market Bull be found anywhere these days?

It’s  taken a while and some pretty scary headlines to do it, but, the eternal bulls of the previous decade have finally been silenced only to pick up the eternal damnation song of the Bear Market crowd. A little prematurely, I might add.

dow1At times like these, as I’ve written before, one needs to stand back and assess the ‘mindset of the many’.

If you do take the time to really look at the markets and use historical perspective (instead of newsmedia-driven emotions and justifications) to make your decisions, you’ll find that you’ll be standing pretty much alone in your conclusions.

When looking at the Daily evidence, we’ll see that the trend is, unbelievably, upwards.

The chart clearly shows this to be true, regardless of the ‘feelings’ in the air to the contrary.

Historically, we’re heading for (and, should be expecting), the Seasonal Highs. But, for the moment, the trend is upwards for the Daily (short-term) trend.

To understand better the complete context, we need to look at the Weekly and Monthly trend results as well which we’ll do in our next post. – George

—————————————————————————————————————

LogoPNG-GannGroup-400

It’s never too late to Learn, and, that includes learning about just what makes these markets tick.

Real comfort can be derived from knowing that the same Principles used so successfully by W.D. Gann over a hundred years ago still work in the markets today. They, (the Principles), always will as long as 2+2=4 and other mathematical relationships remain in effect.

galileo-galilei-343034Wouldn’t you rather be operating by these unchanging Rules when you’re trading the Markets?

Consistent Principles applied rationally will yield Consistent Results.

They must!

This is the point and the goal most profess to be searching for.

Do you really understand the Principles behind:

TREND, STOPS, PRICE OBJECTIVES for SELLING & BUYING?

If not, take the time to Learn the Principles which have always driven the markets and always will.

We’ve developed teaching tools that can help those dedicated to this Quest for Wisdom. Over 45 years of research and practical testing have proven what is good, useful and lasting.

READ MORE ABOUT THESE COURSES ON THIS SITE AND THEN . . . CONTACT ME HERE BY E-MAIL FOR PRICE AND AVAILABILITY.

——————————————————————————————————————————–


WD Gann’s Advice . . .


. . . FOR SPECULATORS & INVESTORS

GannImages&Quote

W.D. Gann urged all students of the Markets to study and learn from past experience and History.

I’d add that there are Universal Concepts that always have applied and still apply to the Markets.

These concepts are largely invisible to traders and investors and, one must learn them in one of two ways: through long years of experience through loss and failure or, alternatively, by learning from others who have discovered these Market Truths independently.

Nature will respect either Path to Truth.

If one chooses the second way, they can obtain the information and wisdom of decades in a short time.

This way one may substitute a tuition fee for the long years of personal study, test and failure.

Money thus substitutes for Time in this choice, but, one still must possess the self-control and discipline to apply what is learned.

If you’d prefer to choose this Second Path to Market Truths, then, I’d like to encourage you to take a closer look at The Harrison-Gann Trade Secrets Master Course or the other separate courses and sets of technical trading method discoveries available on this website exclusively.

They will save you decades of work and losses.

Write me HERE for availability and cost. – George

Buying New Highs


Buying New Highs: HOW IT’S WORKING FOR GOLD

Gold2016 Our previous post with Mr. Gann’s Rules for Buying new highs has been proven yet again for the GOLD market.

In the case of GOLD, we posted on January 28th two BUY signals that were generated.

One had already taken place at the $1090 price level.

The next future BUY signal was projected at the $1150 price level.

This price was hit and so created a BUY opportunity at a new high for this cycle. Most people are too fearful to buy at new highs, however, this is where half of the greatest profit opportunities lie (the other half being selling new lows).

When buying new highs, one should follow Gann’s instructions (see my previous post).

As our BUY point already qualified according to Gann’s Rules, it was an ideal place to enter this market as this is a new Monthly trend that will have great momentum. The potential gain from the second entry point was $9200/contract and, the potential gain from the first BUY price level is over $15,000/contract to date.

All this in less than 2-months time. These short time frame moves with high gain profits again confirm my earlier writings about a handful of cautiously chosen trades offering the lion’s share of profits for the Year.


What Did WD Gann Teach?


WD Gann: Buying & Selling at New High & Low Levels . . .

GannLessons1

From W.D. Gann’s Stock Market Course

COMMENT: It’s easy to overlook this investment gem in the heat of emotion in the markets. However, when prices take out new lows as we’ve seen happen over the last several years, people (as a whole) hesitate to follow their lead. The theory is that prices will turn around ‘this time’ for sure, but, that’s playing a 15% probability at best (and usually much low odds than this).

Trends are established over time and hold a good deal of momentum when they become visible to the average trader and investor. Those trends have a strong 80-85% probability of following through when they are in motion.

These are not odds to walk away from when one has the chance to put those same odds on their side. These aren’t my own opinions solely (as seen from the quote above from Gann’s own course), and, I’ve gone over the Historic Charts and proven it’s worth for myself.

Gann thought enough about the Art of Buying & Selling at New Levels to make it one of his cardinal Rules (#4):

GannLessons2

You should follow the same path to Truth as written by Gann. It’s a fundamental Law of Truth that will work for you. Examine the markets and PROVE ALL THINGS for yourself. – George

Nikkei Followed Through On Our Downside Expectations


The Nikkei Declines Further As Expected

nikkeiThe Nikkei has begun to decline again in price with the start of this new week, much as our signals suggested and our SELL signal that we reported on Saturday last.

This may only be the opening theme for the week, with more decline to follow in it’s wake.

Momentum had already shifted to the downside and, today’s actual declines in price action will only further solidify that downward momentum.

Other stock market indexes are also showing the same weaknesses and their interconnected financial threads will tug on all when just one of the large indexes start to pick up speed in decline.

As mentioned in our earlier post, as this is a Daily Sell signal, it’s effects will take days to develop instead of hours. George

Nikkei 225 SELL Signal Triggered


Nikkei 225 SELL Signal is Triggered

nikkeiIt looks like the recent downtrend in the Japanese stock market is about to continue it’s descent this week.

A SELL Signal was triggered with the drop in price to the 17000 level.

Momentum has shifted back to it’s negative direction and indications are strong for a further descent this week.

This market will lead off the pack for Monday and isn’t the only Stock Index that’s giving signals to SELL on weakness.

As this is a daily chart giving these indications, we can expect the downtrend to last days and not hours as with intraday trends. – George

AUD/USD Support Price Area


Practical Applied Gann Knowledge in Forex (AUD/USD)

audusd1Most don’t expect that WD Gann’s work can be applied to intra-day trading, but, that’s only because Gann left no chart examples of his intra-day trades.

Gann was an exchange member who did his own trades.

But, by all evidence he wasn’t a ‘cowboy’ trader.

Instead, I submit that he instead, carefully calculated out his potential positions against the backdrop of intimate knowledge of the market that he was to trade in.

This submission is backed by important eyewitness statements that actually give us a good deal of useful information when given some thoughtful consideration.

According to witnesses, when Gann went into the pits to trade he carried all the information he needed on only a single piece of paper.

audusdThere are two things we can learn from this piece of information:

  • Gann went to trade with a definite PLAN of action and knowledge of the market he was trading in.
  • Secondly, the very fact that he carried this piece of paper with him meant that his methods COULD apply to intra-day trading.
  • Proof enough, even without the charts, that Mr. Gann’s methods could work in ALL Time frames.

Take a look at the short-term AUD/USD and our charts above and to the left.

Some of Gann’s techniques were applied to this forex market and found that an important price point has been broken and, where another price support area is waiting below the present market.

An important price support was taken out at .7065-.7070 and, the market has weakened as a result. If this market weakens further, it should reach some good price support at around the .7030-.7035 price area. – George

Applied ‘Gann Astrology’: Astro-Signals for Gold


Applied ‘Gann Astrology’: ASTRO-SIGNALS FOR GOLD

golddaily ‘Gann Astrology’ indicates that the Daily prices for Gold have now moved into strengthening daily upwards trend formation.

Prices have tripped out of their intra-day trends and moved into a firm, upward price trend.

While this is a daily trend only at this time, using what I call ‘Gann Astrology’, we find that we’re very close to an important momentum pivot point.

If prices manage to stage continued strength to the upside, we will trip into a new, much more powerful and long-lived Monthly trending market for Gold.

Let’s take a closer look at the critical price point I’m writing about by going to the chart listed below showing the Monthly trend for the Gold Market. The BUY daily price point shown on the chart above will be shown on our Monthly chart as the smaller of the two circles. The larger circle shows the price area we’re watching for now.

goldmonthlyWe’re looking at the downtrend that started from January of 2015.

We’re now at an important Yearly anniversary of that price spike area and should expect some type of market response.

As the earlier comments stated, we’ve broken into a strengthening Daily price trend already.

That’s important, but, it’s happened during the Anniversary of the previous HIGH and . . . THIS COULD BE THE RESPONSE WE’RE EXPECTING ON THIS ANNIVERSARY PERIOD.

Now, if prices can move into the $1140-$1150 area and CLOSE there for more than a few days, according to the ‘Gann Astrology’ approach we’re using here, we’ll have our signal for a significant rise in Gold prices to come. George

Enjoy the Show, But Locate the Exit . . .


Enjoy the Show, But Know Where the Exit Is . . .

Brent7The exit to the trade is the STOP price point or the manual exit order point. For the last 2-days now, we’ve been following a string of Brent Crude Oil trades using ‘The Excalibur Trading Method’ applied to this market on an intra-day basis.

We’ve been following the latest reversal to the downside and, even the rally that followed failed to hit our STOP point for this hypothetical trade. The STOP point as of the time of this post is just above the New 2nd SELL Signal point.

This STOP will lock in about $1,000 of theoretical profit from the last few hours if hit, but, if prices decline further the STOP will be automatically adjusted downwards at an optimal market point to accommodate the current trend. – George

The ‘Exit’: The Other Half to the Trade!


The ‘Exit’: The Other Half to the Trade!

While our entry signals have been proven over time and experience to be very special indeed; they’d be handicapped if we didn’t also pay attention to their ‘other half’; The EXIT to the trade. 

Brent4Yesterday’s and Today’s Brent Crude Oil trade signals are a case in point.

There was a total of $3,200  USD in potential downside & upside trending profits (per contract) offered up by the Market in just the last 24-hours or so.

This potential came from over a $1,000 price move on downside trend & over a $2,200 price move on the upside reversal that followed.

All this, just by working off of the signals given by this unique Methodology.

It’s critical to remember this; Once in a trade, one needs to be able to detect the point of exhaustion for that trend and, it’s price break-out point in the opposite trending direction.

The same technology that generated the Entry Signals shown these last two days (from The Excalibur Trading Method Course), could be used to follow the trade’s trend and detect it’s Exit or Reversal point to go Long again. Just as it will detect the end of the present upswing in prices.

This is a Science, not magic or opinion.

Opinion plays no part in this process. The market will guide you along it’s natural course if you’re able to read it’s hidden, subtle signs.

You must possess both sides to the trading equation; otherwise opinion/emotion will creep into your decision process and rob you of the optimal results.

This why you shouldn’t take trades from the signals given on this website (the examples are purely for educational purposes only anyways: read the disclaimers), as, unless you have ‘The Excalibur Trading Method’, you won’t have the same insight into where the Exit point to a trade will be (and I don’t usually publish both points as I’m not up 24-hours to follow trades in the global markets).

Keep in mind this:

In most cases, traders do two things: Get out too early or, (more costly), stay too long in a market move. George

1 44 45 46 47 48 58