
How To Deal With A Market Turn Around
How To Deal With A Market Turn Around
 Yes, it happens.
Markets can surprise any of us and the best of our logic will, eventually, have to fail us at turn around trend points of importance.
When markets change, we must adapt and quickly to the one and the only reality of the markets: Price.
Brent Crude Oil is the latest piece of ‘humble pie’ to digest.
Although all the signs were in place for the usual rally top, the last important indicator, the breaking of Brent Crude’s price below $37.50 (which we noted in our previous post) never occurred.
The 45° support line held price at bay from a steep decline. Now, this same angle line has pushed the support up to the $39 level with this price now acting as our early indicator for a price collapse if price closes below the $39 level.
Price surged upwards past the last two month’s highs indicating further strengthening and buying.
The fact that price couldn’t drop below the 45° angle showed that selling had dried up and that this price pull-back wasn’t of the same nature as the previous ones. At that point of ‘non-confirmation’, one had to accept what was being said by the Markets about the real trend of the market; prices were going higher.
Although, we could still be making a top, price must close below $39 now to confirm that the switch in trend to the downside is significant & real. – George
A Refined Analysis of Crude Oil
WD GANN: SOME REFINED ANALYSIS ON THE CRUDE OIL MARKET
The mysteries of the recent massive decline in Crude Oil are many, but, two questions of import rise to the top of the list . . .
- Why such a massive decline?
- And, how can we tell when the decline is either over or going to continue?
THE FIRST QUESTION: Well, the first question is simply that Time ran out for CRUDE OIL at high prices.
The approximately 30-year Commodity Cycle which last strutted it’s stuff in 1980 was due and came at last to the crude oil market as it did to the grains, copper and gold markets.
THE SECOND QUESTION: As for the second question of where we are within the Crude Oil downtrend, we’ll further refine our answers in the next two charts which follow and which may provide some valuable guidelines to temper our emotions when watching the daily price action.
Many expect a rebound in price. Perhaps even a reversal in the trend. But, how will you determine ‘the real deal’ from the ‘hopeful’ emotional response?

Young WD Gann
WD Gann, THE market master from the last Century found several ways to answer these questions.
Indeed, these rediscovered techniques of his have proven, at least to me, that Gann was a true Renaissance Man.
As a market analyst genius, he is, even today, largely unappreciated and undiscovered by the vast majority of investors and traders who think his claim to fame are a few stories, some strange angles, mysterious circles and enigmatic squares which he left behind in some notes, charts and courses.
One of the marks of true genius is, however, when the techniques discovered still work over a Century later!
Yes, Time is the great tester of Truth.
So, let’s take a look at Crude Oil, like we did previously for the Stock Market and Gold through WD Gann’s eyes, so to speak and applied to today’s price charts.
The chart below shows where the present invisible Resistance price level is for Crude Oil.
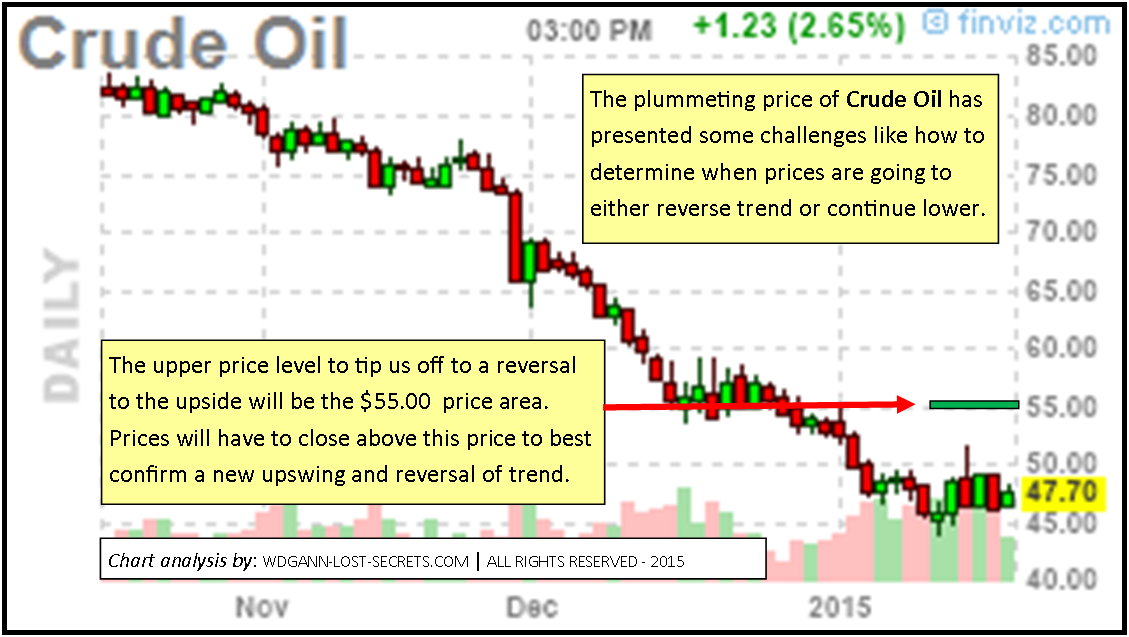
A counter-trend will have to be able to break through the $55.00 price area to confirm enough buying pressure is available to absorb the selling pressures presently in the market.
This answers the question as to if we’re in an uptrend or not: Until prices rise above 55.00 and hold; we’re still in a downtrending market.
At present, we’re experiencing a pause in the downtrend. The next question becomes then; how will we know if the downtrend is going to resume? That answer is also supplied from the lost Gann secrets and is illustrated on the chart below for your examination . . .
The chart below shows where the present invisible Support price level is for Crude Oil.

This chart answers the question as to if the downtrend will be continuing or not: Until prices fall below 41.00 and hold below that price; we’re still in a sideways trending or holding market for Crude Oil.
These are the price limits for support and resistance on a daily basis for Crude Oil as of this date. – George
Crude Oil Prices Hit ‘Wall of Time’
This is post is republished from our WDGann-Lost-Secrets.com website
CRUDE OIL PRICES HAVE NOW HIT A ‘WALL OF TIME’
Crude Oil prices have now entered a crucial price zone. In fact, prices have hit what I call a ‘Wall of Time’ which makes further sideways price movements difficult to sustain.

Chart courtesy of Finviz.com. All charts are for educational purposes only.
SELECT ACCESS TO MEMBERS ONLY
As to what will follow for Crude Oil prices, that’s reserved for the private members section of this post.
JOIN TODAY and stop guessing what the market’s are going to do next. Learn and anticipate the major market moves.
The initial trial membership level is Free, but, you have to take action and sign up.
Are you just a passive reader or are you looking to seriously engage the markets using knowledge and the laws of market behavior?
Don’t Stay in the Dark: JOIN HERE TO SEE THE CRUDE OIL CHART AND COMMENTS.
What Follows is Reserved for Members of the WD Gann Traders Group . . .
[private_WD Gann Trading Secrets Group]
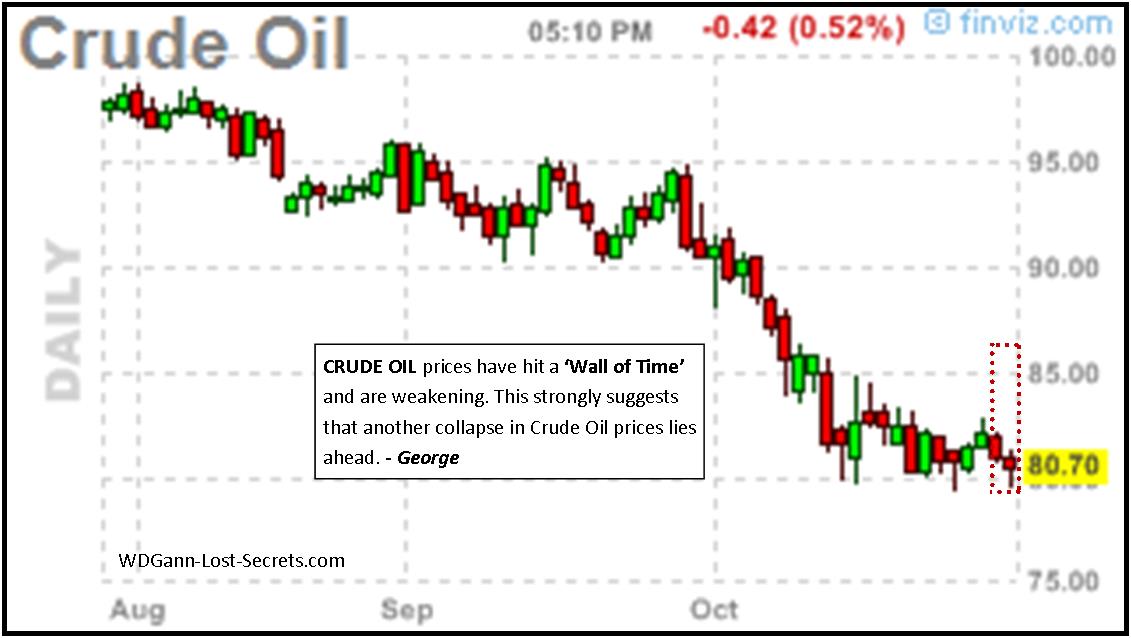
Chart courtesy of Finviz.com. All charts are for educational purposes only.
Prices can only verify a reversal to the upside by closing on a daily basis above $82.50.

Chart courtesy of Finviz.com. All charts are for educational purposes only.
Expect prices to drop dramatically again with $76.50 as a support price target initially should the low of 5-days ago be taken out.
– George [/private_WD Gann Trading Secrets Group]