‘The Excalibur Trading Method’ Update on Gold & GBP/JPY Trades
‘The Excalibur Trading Method’ Update on Gold & GBP/JPY Trades
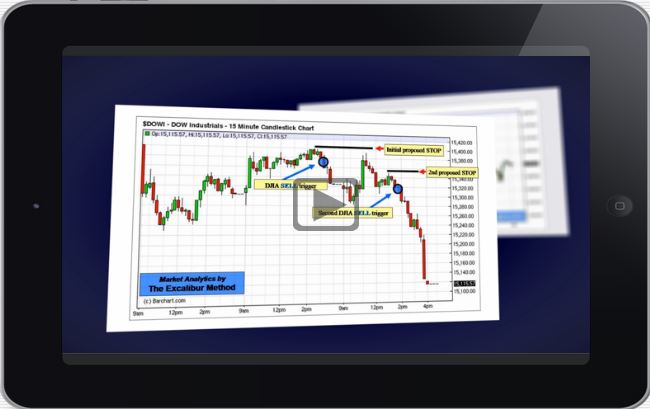
Click Chart to Enlarge
Click Chart to Enlarge
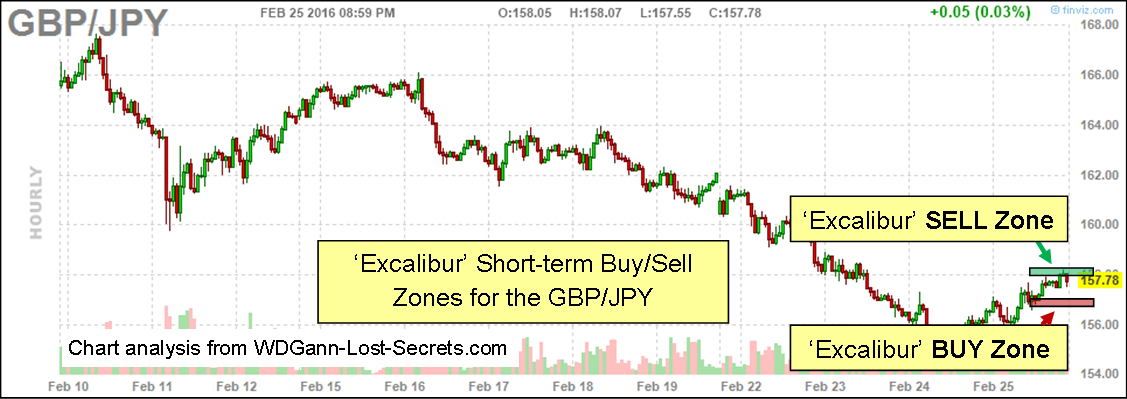
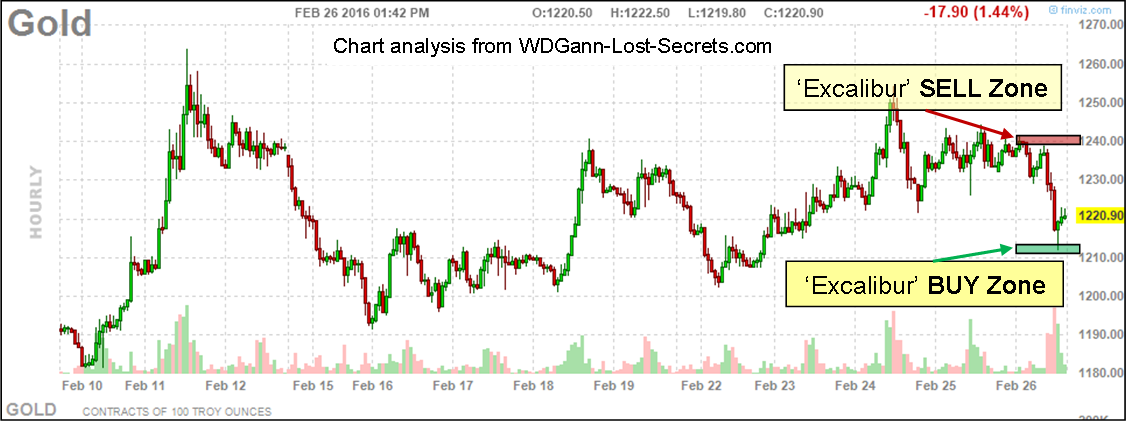
Here are the charts for the Gold & GBP/JPY trades posted just before this one.
This time, I’ve shown the important BUY and SELL price zones that are being targeted for these two markets on the short-term.
You’ll find the SELL Zone areas shown with a green horizontal bar.
The BUY Zone price areas are shown with a red horizontal bar.
The GBP/JPY is at the top end of a short rally and in the SELL green zone.
As for GOLD, it has recently pulled back in price and has touched it’s red BUY Zone bar indicating that it has a high likelihood of rebounding back upwards.
In both cases, we have looked at the longer-term trend to confirm trend.
Only after knowing this do we narrow our focus on the short-term trend and SELL against rallies for the down trending GBP/JPY and BUY the pullback in Gold prices as the larger trend for this market is UP.
Note, as always that this is purely an educational exercise and not an advisory or solicitation to buy or sell. Read our extensive disclaimers to this effect.
Observe and learn what is possible using ‘The Excalibur Trading Method’.
Contact me HERE when you’re ready move up and obtain this World-Class, Premium Tool to apply to your own trading. – George
———————————————————————————————–
Crude Oil Timing
IF YOU WERE A MEMBER . . .
. . . YOU’D BE SEEING OUR LATEST CHARTS REPORTS RIGHT NOW!
FOR MEMBER-EXCLUSIVE ACCESS & MORE DETAILED VIEWING:
CLICK HERE
. . . . . . . . . . . . . . . . . . . . . . . . . . . . . . . . . . . . . .
Crude Oil: Timing the Shift in Trend
NEW UPDATE: 8/29/15
. . . . . . . . . . . . . . . . . . . . . . . . . . . . . . . . . . . . . .
[private_GANN TRADING GROUP]
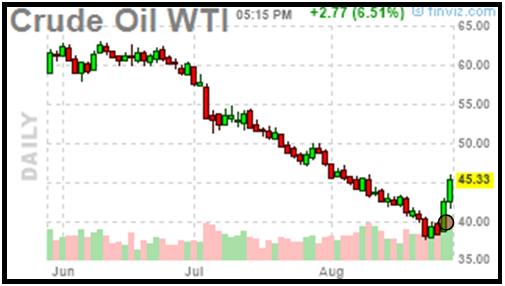
OUR ONGOING CRUDE OIL SHORT TRADE SELECTION HAS FINALLY ENDED & REVERSED TO LONG
Today’s post is an update on our previous short trade in Crude Oil since June.
Using the Excalibur Method (and confirmed by other Master Course techniques) we detected a shift in the price momentum in WTI CRUDE OIL on August 27th.
 This price point of focus was $39.50, with prices above this triggering an exit from our theoretical Short and reversing to a Long outlook; but, only on a very limited short time frame.
Here’s the reason: The angle of ascent for price now is too steep from the August 27th breakout to Friday; far too steep to maintain. However, this won’t prevent us taking the opportunity to take our theoretical grab at a bit of this upside action and get into position for the next down leg when this upsurge breaks (as it must).
We’ll have to follow the upside movement at a shorter time frame rather than the daily chart level shown above.
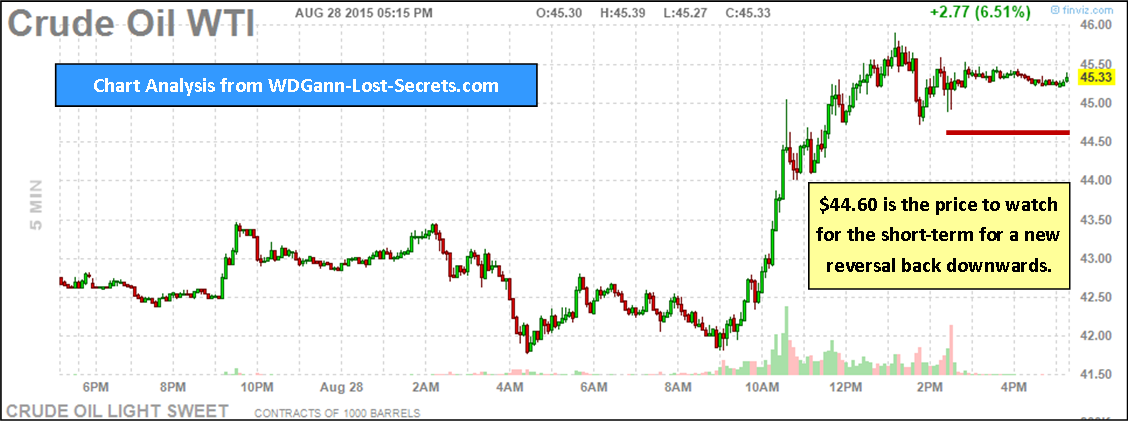
What to watch for: If new highs are not made and If we get an hourly bar that closes below $44.60 with most of it’s bar range below that price; then, we may assume that the short-term upsurge is over, and, a continuation of the previous downtrend will continue. – George [/private_GANN TRADING GROUP]