
Gold Update
The last GOLD post was our preliminary look at Gold at the beginning of 2015. We started at the intraday level, examining the current state of balance at that level. What we found was that the intra-day, short-term outlook was weak and, two short Excalibur Method trigger signals were generated.
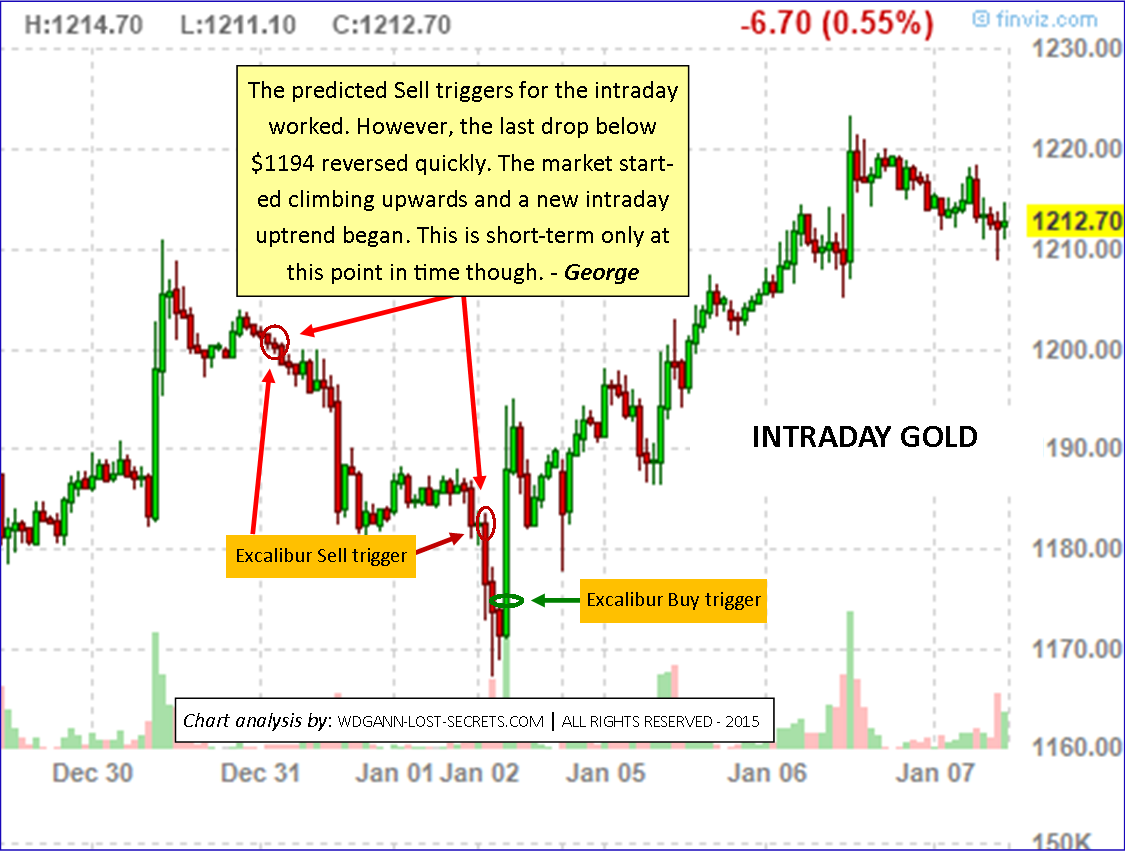
The last was issued as a SELL point when posted and, indeed prices dropped rapidly after posting by another $15/oz. or $1500/contract within 2-hours time! Prices rapidly bounced back upwards again (as shown on the chart) taking out the hypothetical hourly Excalibur short position and was a good place to reverse to an hourly Long position. which has continued to hold up to the time of this post write-up. This upwards bias for price movement can be viewed on the chart following which shows bands representing selling pressure (the lower band) and buying pressure (the upper band).
 . It must be kept in mind at all times that even this little upswing needs to be placed in proper perspective. This price movement is nowhere near enough to counter the downtrend in Gold going back to 2011.
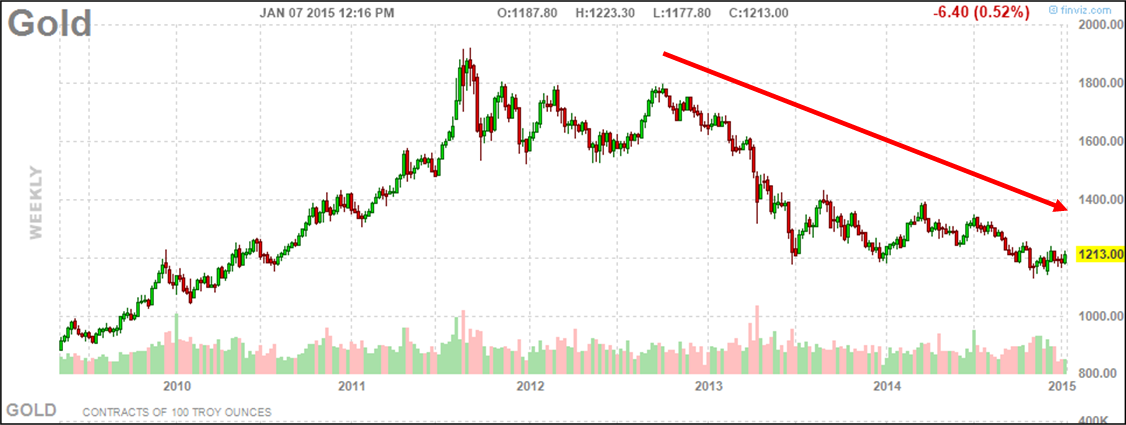 That trend is strong and has enormous momentum still. However, major trends always begin as minor trends first, so, we’ll keep an eye on the market while noting the ‘bigger picture’ trend. The chart below is a closer time perspective going back a year.
 We continue to find a strong downtrend in progress and one that hasn’t been interrupted to this point. A price move above (and, staying above) $1260 is needed to overcome the downside selling pressure in this market. – George
GOLD: Intraday Chart
We’re starting the New Year out looking at the intraday GOLD market to assess how it stands.
First observations are that we’re in a weak position on the hourly and even on the daily with (Excalibur Method) SELL triggers already given twice.
Check out the chart . . .
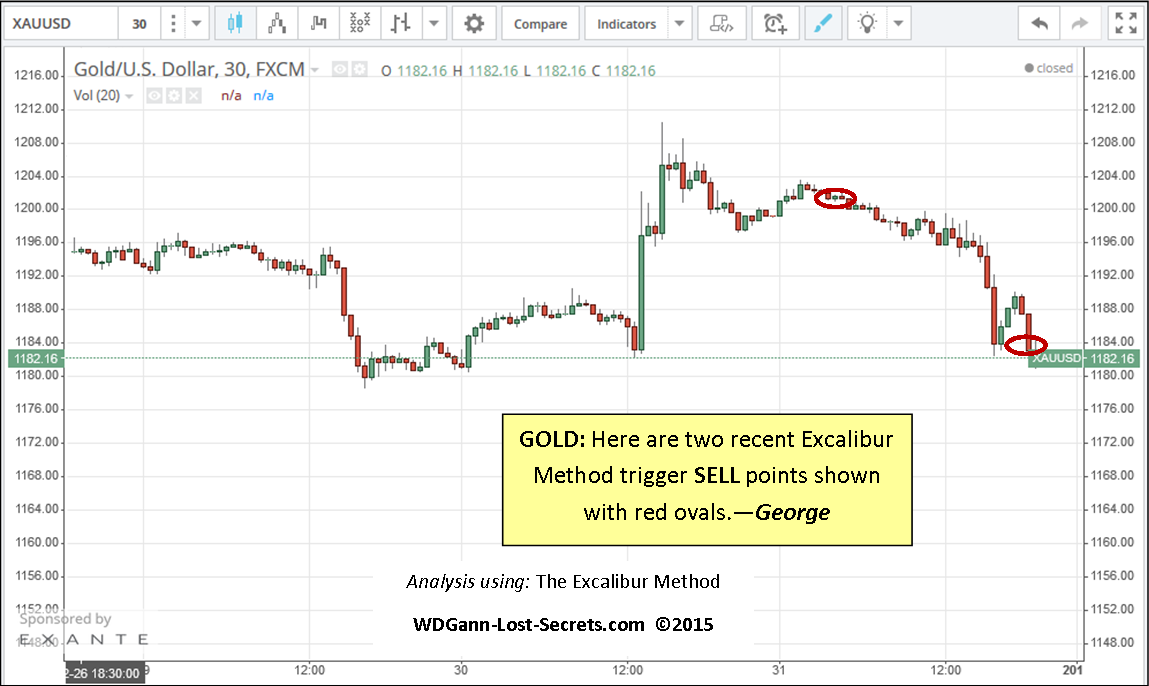
The red ovals show the first points of trend change. Keep in mind we’re looking at half-hour bars here, so, this trend is short for the short-term within the larger trend. Expect a drop from here especially if we complete a half-hour bar whose range is largely lower than the oval indicated price area of $1154.
An uptrend will require that we take out the $1192 price level with bars and their ranges above this price. Again, this would be an extremely short-term trend.
This is just a preliminary look at GOLD, we look deeper in the coming days ahead. – George
Latest Gold Price Prediction Met
THE GOLD PRICE PREDICTION WAS MET FROM OUR PREVIOUS MEMBER’S PRIVATE POST
Our private members were able to see this chart a few days ago:

Chart courtesy of Finviz.com . Charts are displayed for educational purposes only. Read Disclaimer.
This was the predictive chart for the unknown future that only our private members had access to.
Let’s see what happened . . .

Chart courtesy of Finviz.co . Charts are displayed for educational purposes only. Read Disclaimer.
Gold prices dropped as predicted to the predicted price in the previous post which was a market move with a value of $2,800! – George
![]()
What’s Gold Up To? Going Beyond the News
GOLD’S IN THE NEWS AGAIN. WHAT’S IT MEAN?
Word is out that Gold’s on the rise again and that the Bear market in Gold has ended.
Who says so? Why the media experts and, of course, the gold dealers who are perennially long the metal.
If you look at the short-term clipped charts offered to back this in the news, they look like this:
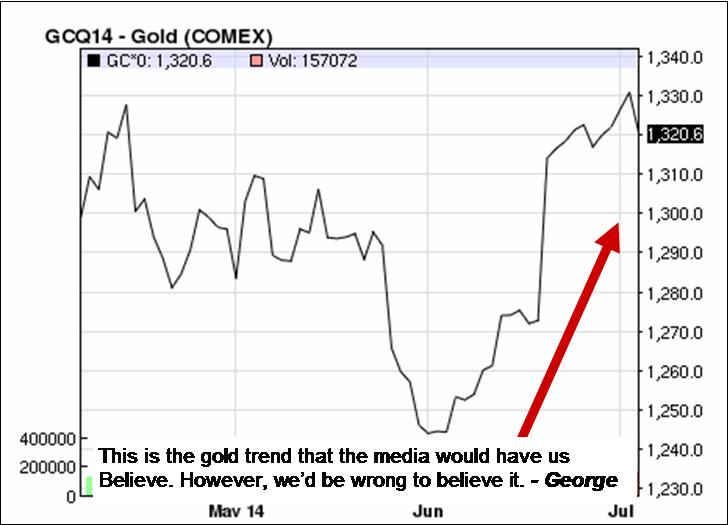
As mentioned in the previous post, the media’s job is to mislead so as to benefit the big players in the markets.
If we fall for this small selected piece of gold price history we’d be falling into a trap and we could be seriously mislead as to the future of this precious metal.
The chart to the left is unbalanced in it’s presentation to traders and investors and, is yet another example of an attempt to place investors on the wrong side of a major market move. In this case, GOLD.
Yes, some profits have been possible short-term on the long side but, is this a market that promises a great deal more upside?
Let’s take a look at a longer time period for prices in this market and discover what so many don’t want you to discover.
And, what is that? Simply this, the Gold market is STILL IN A SERIOUS DOWNTREND on a long-term basis and IN A SIDEWAYS MARKET on the medium-term.
Take a look at the next chart for proof:
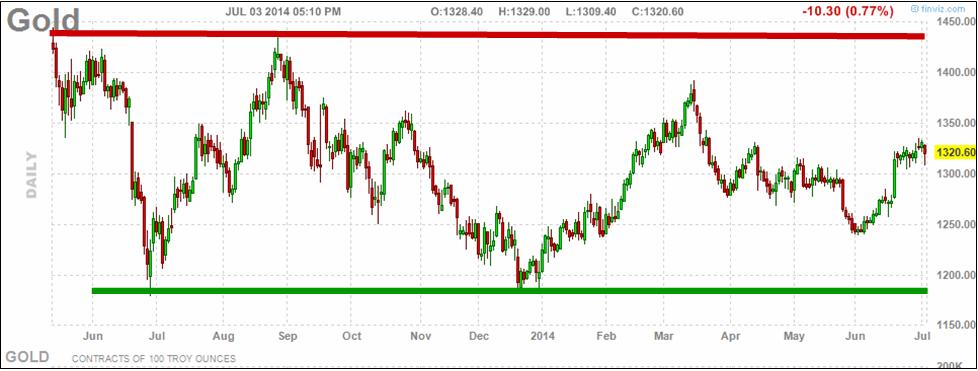
THIS IS WHAT GOLD LOOKS LIKE WHEN WE
STEP BACK A LITTLE TO GAIN THE PERSPECTIVE OF TIME. – George
This chart clearly shows that we’ve been locked into a sideways market for almost 2-years now.
Prices are only at the middle of their range at present, so, they can still go higher while not indicating a new Bull Market at all!
In order to work this sideways range you’ll need a tool that can protect you from too many whipsaw plays
(like that used on this site).
This website’s intention has always been educational and the design of the methods used to analyze the markets has always protective of the trader and investor. To do that I’ve had to discover and re-discover (in Mr. Gann’s case) the fundamental laws of the markets and their structure. By doing so and analyzing markets with these tools, a more stable and reliable result can be found. One that inspires growing confidence with use.
The results speak for themselves as the archives will show and my mission has been to teach the principles and methods that will allow you to do the same for your own interests and investments.
If you want to know more, take the time to click the banner below and send me an e-mail requesting price and regional availability. Thanks. – George

![]()