
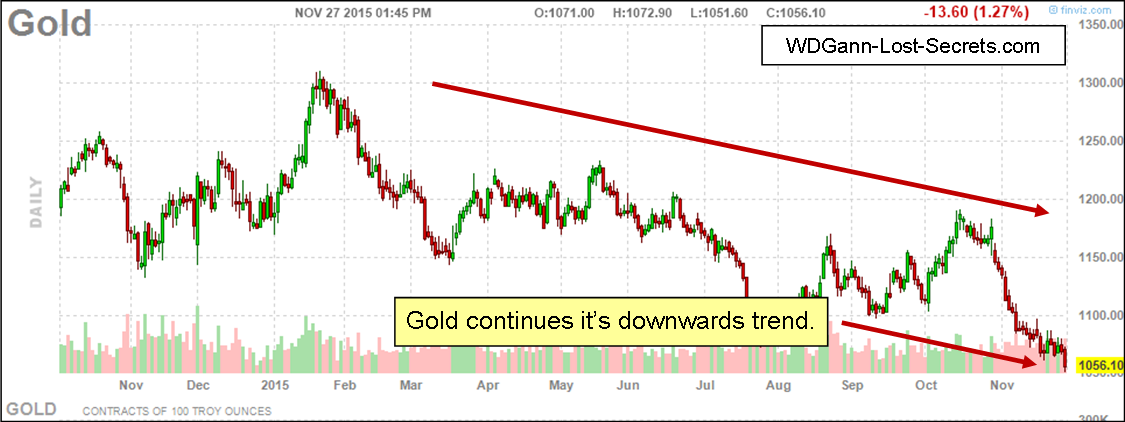
Gold Prices & Deflation
GOLD PRICES AND DEFLATION
Gold’s Current Trend . . .
Click on the Title above to go to the Report and Charts.
——————————————————————————————————
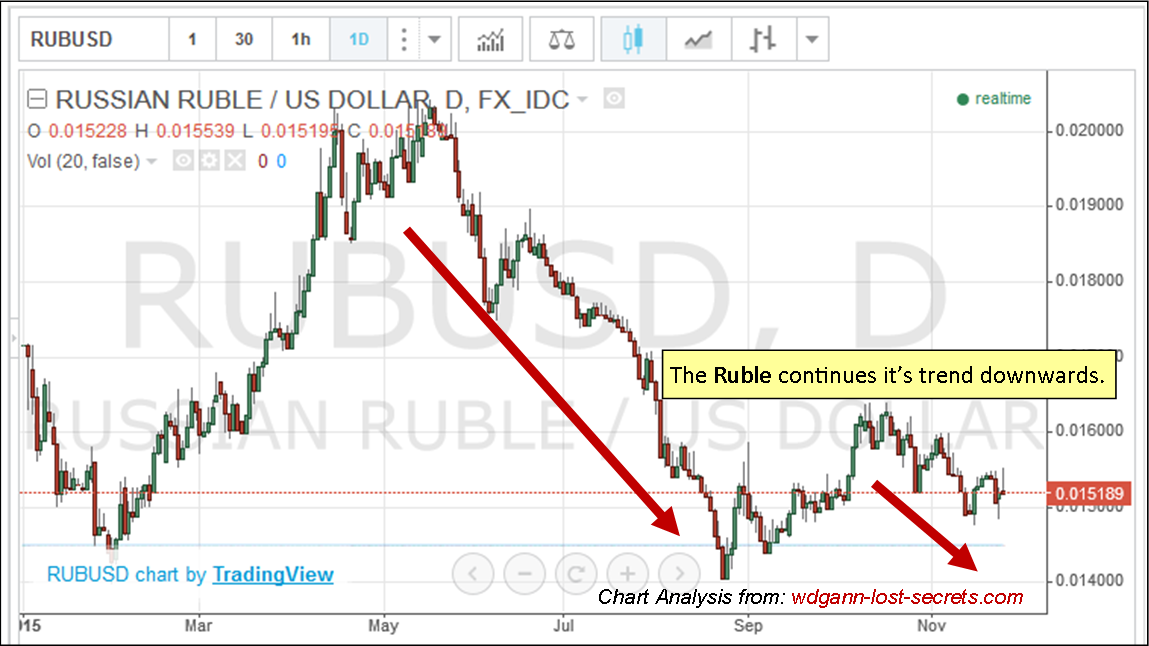
Russian Market Trends & What They Predict
RUSSIAN MARKET TRENDS & WHAT THEY PREDICT
Current Market Trends in Russia . . .
Click on the Title above to go to the Report and Charts.
——————————————————————————————————
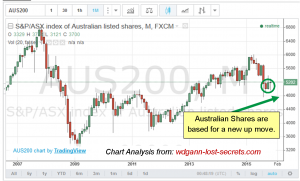
Australian Share Market
Australian Share Market Report
Where the Share Market’s Headed Next . . .
Click on Title or Chart to See Report
——————————————————————————–
Stairway Philosophy
THE PHILOSOPHY BEHIND
THE STAIRWAY TRADING METHOD . . .

. . . “Because a step in the right direction beats a mile in the wrong one.” – George R. Harrison
Introduction & Special
Click the Title Above to Go to the Article
————————————————————————————————————————
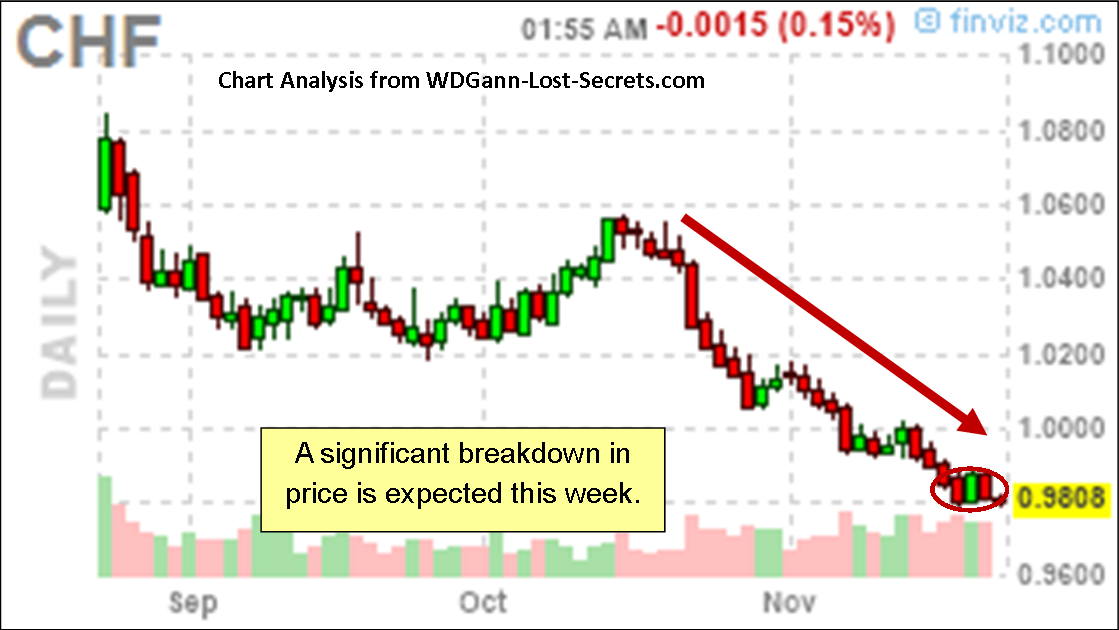
The Swiss Franc Weakening Now!
A REPORT ON THE SWISS FRANC
—————————————————————————-
Swiss Franc Report
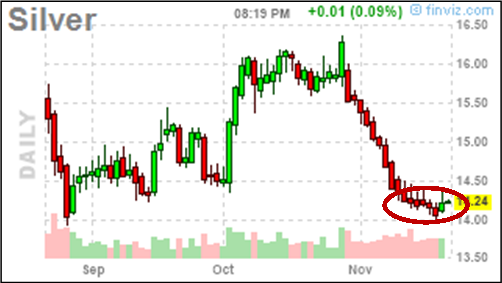
The Next Price Level For Silver?
A SILVER MARKET REPORT
What’s The Next Price Level For SILVER?
Click on the Title above to go to the Report and Charts.
——————————————————————————————————
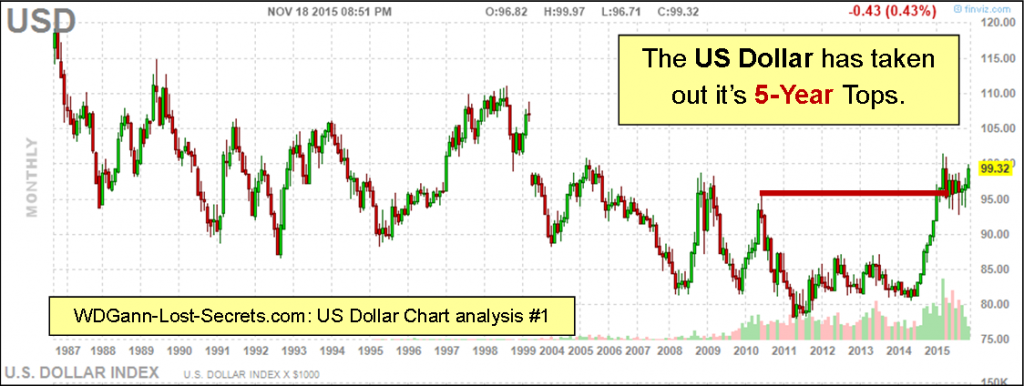
The US Dollar: The Lion of Currencies
A SPECIAL US DOLLAR REPORT
The US Dollar: The Lion of Currencies
Click on the Title above to go to the Report and Charts.
——————————————————————————————————
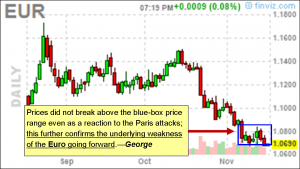
The EURO Going Forward
NEW REPORT:
The EURO Going Forward: Beyond Politics & War
 Click on the Title above to go to the Report and Charts.
——————————————————————————————————
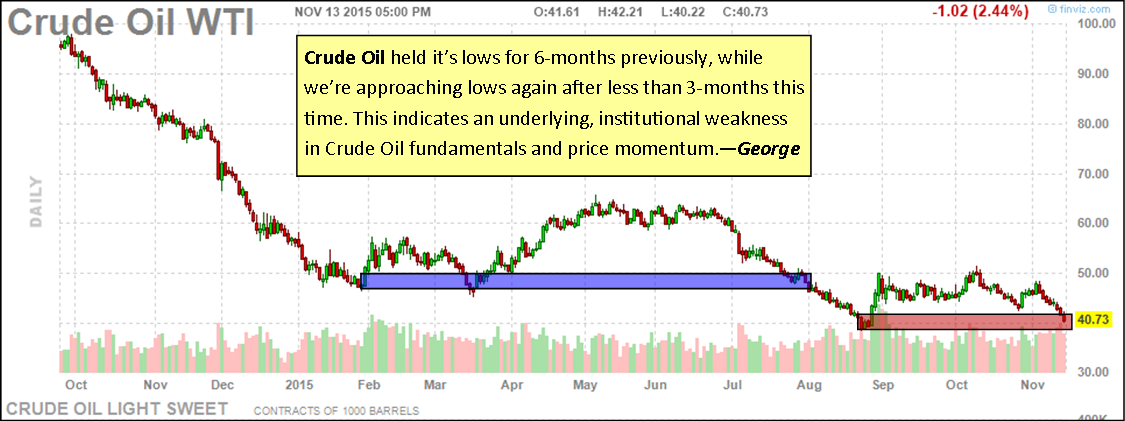
Crude Oil Prices: The Next Round
CRUDE OIL PRICES:
THE NEXT ROUND OF PRICE DECREASES TO WATCH FOR . . .
CLICK CHART TO ENLARGE
Back on our October 27th post, we predicted a drop ahead for Crude Oil Prices.
Prices at that time were $46.86.
Today they reached down to $40.73.
On the short-side, this was a prediction worth a potential profit of $6,000 per futures contract in just a little over 2-weeks time!
Options would have yielded an even greater ROI profit for a smaller investment.
All this further confirming an observable and repeatable truth about trading and the markets: mainly, that a few well-placed trades at strategic price points are enough to provide an excellent income with much less stress than intra-day trading.
Of course the same techniques will work at the short-time frames as well, but, because of the shortened time periods, many more trades and greater volatility within those short time periods make trading a much more intense process. There are several students of the Master Course materials as well as the Excalibur and Stairway Trading Methods that are successful at intra-day trading as this is their comfort zone.
It could be an age thing on my part.
Youth does bring with it daring, impatience and the necessary willingness to take a risk. Youth has lots of time ahead of it and mistakes can be remedied and new attempts made based on the experiences gained.
As one gets older however, there’s a greater willingness to be patient in exchange for lessened risk and greater opportunity for investment success over a longer time period. In short, one becomes willing to take fewer trades stretched over weeks or months in exchange for a much higher potential to win on an investment.
Both approaches can work but, the temperaments behind them are radically different. Know which type of trader or investor you are and work with Time accordingly. – George
The Mythical Fear of Hyper-Inflation
A Quarterly Report:
A Long-Term Perspective On Inflation
(Free ‘Metals’ Edition)
The Mythical Fear of Hyper-Inflation
You can hear the buzzword ‘inflation’ and, the even more fear-inspiring word ‘Hyper-Inflation’ every week without even having to strain your hearing. We’ve seen them used almost endlessly in advertisements and in the media.
Their purpose seems to be both:
- Manipulative (to persuade investors and traders into the opposite trading position of the institutional traders) or
- Promotional (selling gold, silver or ‘inflation-fighting investments’ to the uninformed.
But, where’s the real evidence of danger from inflation or hyper-inflation?
Does this danger even exist today? The short answer is NO, and the proof is provided by LONG-TERM price history as depicted in price charts.
The trick here is to note that promoters of investments or commodity ‘opportunities’ are forced to only use optimized or short-term price charts to make their case.
They have to do this because THERE IS NO CASE FOR INFLATION WHATSOEVER when the reality of historical price movement is presented in it’s entirety.
As the precious metals (GOLD, SILVER & PLATINUM) are one of the most familiar markets being promoted as a protection from hyper-inflation, let’s take an honest long-term view of their price history and the industrial metal COPPER in the following charts.

The Metals have been in a Deflation mode since 2011. – George
Inflation means higher prices in a local currency. Hyper-Inflation means exponentially rising prices in that same local currency.
What we see on these charts is the complete opposite of those two scenarios. In fact, prices have been declining in all these metal markets since 2011!
Instead of being in an inflationary mode, the metals are in a strong declining price environment.
This is called DEFLATION, where prices continue to decline over time (in terms of the US Dollar in this case).
What makes this situation a Global one affecting many nations is that the World Reserve Currency in which these metals have been decreasing in price is also the STRONGEST currency in the Western World; the US DOLLAR! Observe the following chart to confirm this for yourself . . .
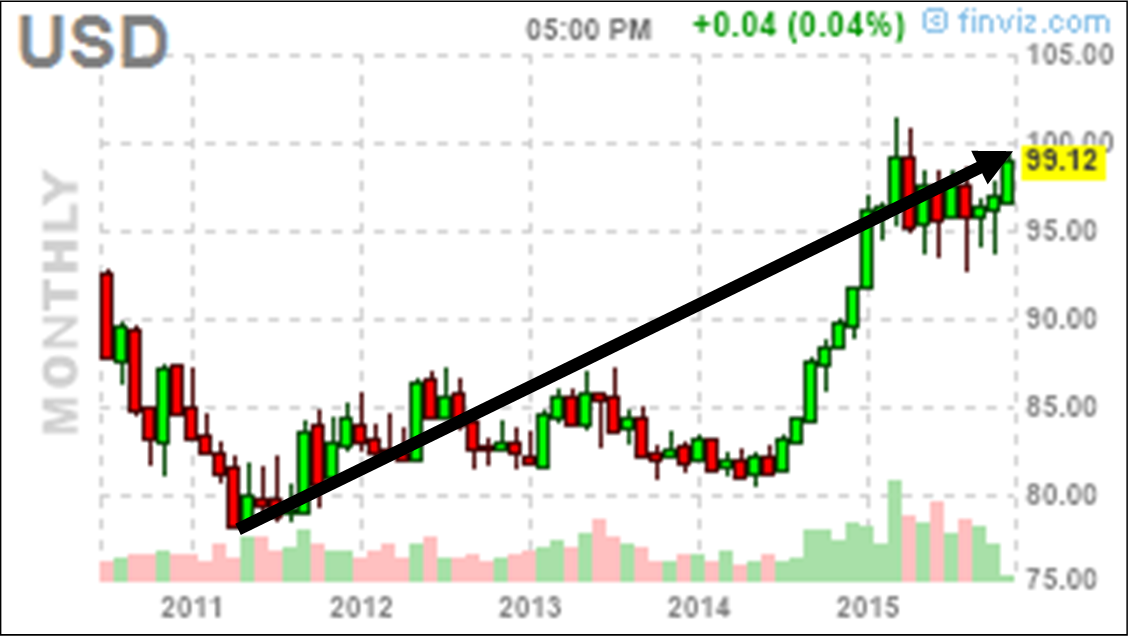
The US DOLLAR has been increasing in value since 2011, not Gold! – George
The combination of a strengthening Reserve Currency AND decreasing prices for Metals priced in that currency is creating Global Deflation and competition for lower prices everywhere. – George
Watch the Eur/usd! . . .
Watch The EUR/USD; Something’s Brewing!
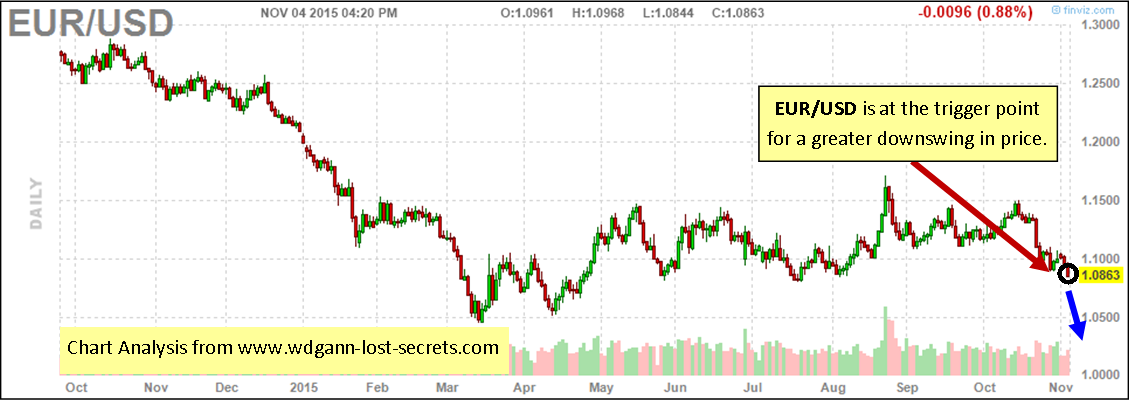
Click Chart to Enlarge for Clarity
As with GOLD yesterday, there are now indications that the EUR/USD is about to drop again.
Price is now in a volatile trigger or pivot area and the trend strength built up over the past several months has been eroded away.
A slight pull to the downside in price will likely cause the avalanche to start. With so much upside momentum dissipated, the previous major downtrend can reassert itself bringing prices downwards and taking out the lows of last March. – George
GOLD Triggered Downtrend Ahead?
We’re Looking at a GOLD Triggered Downtrend Ahead . . .
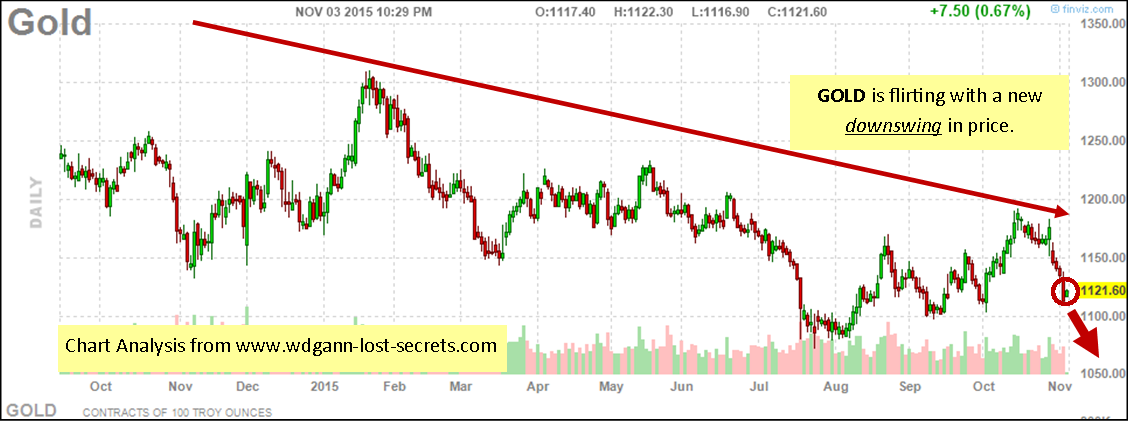
Click Chart to Enlarge for Clarity
GOLD has recently bounced back from it’s downtrend resistance line and has also triggered a signal indicating even more weakness in price.
The chart tells much of the story . . .
The red-circled price area indicates a critical pivotal price area for GOLD.
Breaking below this price region further will likely lead to taking out the lows of last August and, $1100 will be the first test support area followed by $1055 should prices break through this support.
The price trend for GOLD still remains bearish and will continue to be unless prices can surge and break above $1175 this week. – George