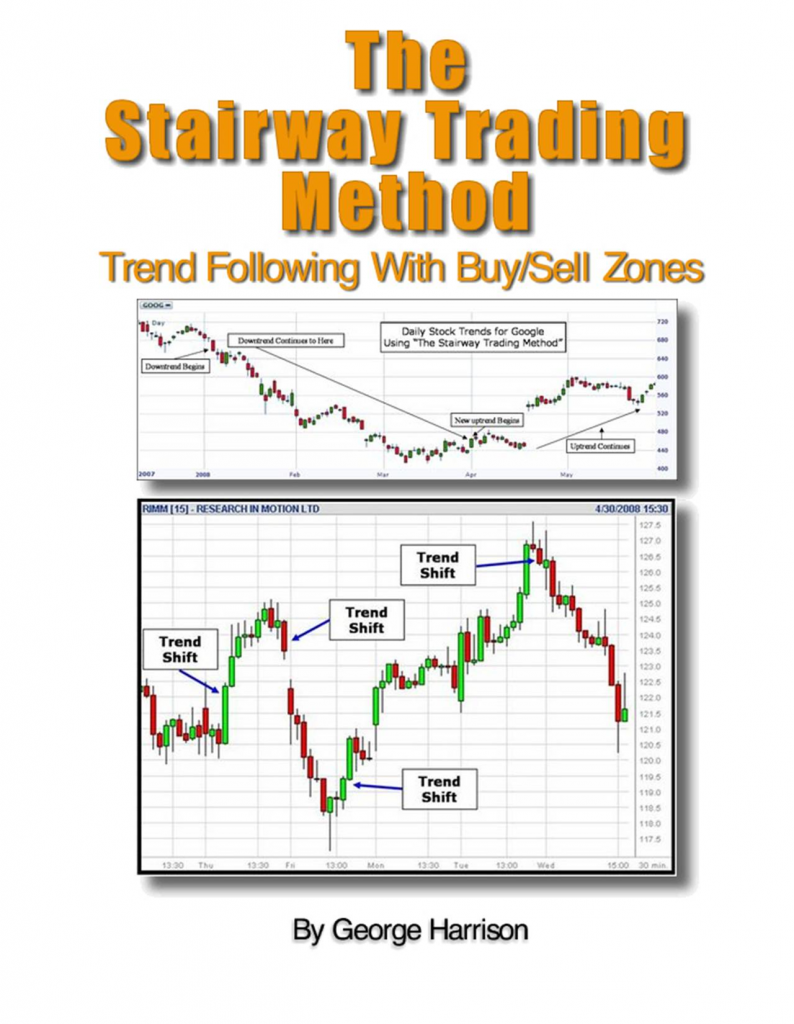
George Harrison

Crude Oil Prices: The Next Round
CRUDE OIL PRICES:
THE NEXT ROUND OF PRICE DECREASES TO WATCH FOR . . .
CLICK CHART TO ENLARGE
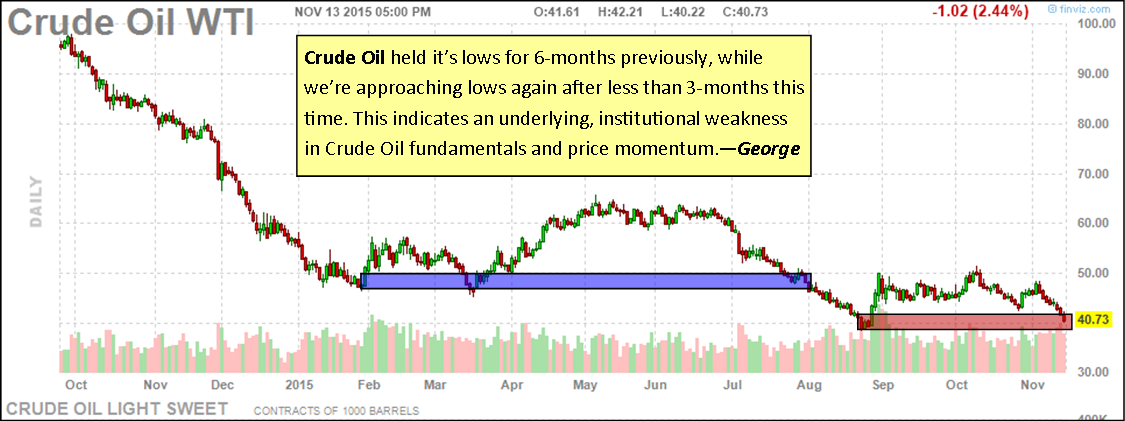
Back on our October 27th post, we predicted a drop ahead for Crude Oil Prices.
Prices at that time were $46.86.
Today they reached down to $40.73.
On the short-side, this was a prediction worth a potential profit of $6,000 per futures contract in just a little over 2-weeks time!
Options would have yielded an even greater ROI profit for a smaller investment.
All this further confirming an observable and repeatable truth about trading and the markets: mainly, that a few well-placed trades at strategic price points are enough to provide an excellent income with much less stress than intra-day trading.
Of course the same techniques will work at the short-time frames as well, but, because of the shortened time periods, many more trades and greater volatility within those short time periods make trading a much more intense process. There are several students of the Master Course materials as well as the Excalibur and Stairway Trading Methods that are successful at intra-day trading as this is their comfort zone.
It could be an age thing on my part.
Youth does bring with it daring, impatience and the necessary willingness to take a risk. Youth has lots of time ahead of it and mistakes can be remedied and new attempts made based on the experiences gained.
As one gets older however, there’s a greater willingness to be patient in exchange for lessened risk and greater opportunity for investment success over a longer time period. In short, one becomes willing to take fewer trades stretched over weeks or months in exchange for a much higher potential to win on an investment.
Both approaches can work but, the temperaments behind them are radically different. Know which type of trader or investor you are and work with Time accordingly. – George
The Mythical Fear of Hyper-Inflation
A Quarterly Report:
A Long-Term Perspective On Inflation
(Free ‘Metals’ Edition)
The Mythical Fear of Hyper-Inflation
You can hear the buzzword ‘inflation’ and, the even more fear-inspiring word ‘Hyper-Inflation’ every week without even having to strain your hearing. We’ve seen them used almost endlessly in advertisements and in the media.
Their purpose seems to be both:
- Manipulative (to persuade investors and traders into the opposite trading position of the institutional traders) or
- Promotional (selling gold, silver or ‘inflation-fighting investments’ to the uninformed.
But, where’s the real evidence of danger from inflation or hyper-inflation?
Does this danger even exist today? The short answer is NO, and the proof is provided by LONG-TERM price history as depicted in price charts.
The trick here is to note that promoters of investments or commodity ‘opportunities’ are forced to only use optimized or short-term price charts to make their case.
They have to do this because THERE IS NO CASE FOR INFLATION WHATSOEVER when the reality of historical price movement is presented in it’s entirety.
As the precious metals (GOLD, SILVER & PLATINUM) are one of the most familiar markets being promoted as a protection from hyper-inflation, let’s take an honest long-term view of their price history and the industrial metal COPPER in the following charts.

The Metals have been in a Deflation mode since 2011. – George
Inflation means higher prices in a local currency. Hyper-Inflation means exponentially rising prices in that same local currency.
What we see on these charts is the complete opposite of those two scenarios. In fact, prices have been declining in all these metal markets since 2011!
Instead of being in an inflationary mode, the metals are in a strong declining price environment.
This is called DEFLATION, where prices continue to decline over time (in terms of the US Dollar in this case).
What makes this situation a Global one affecting many nations is that the World Reserve Currency in which these metals have been decreasing in price is also the STRONGEST currency in the Western World; the US DOLLAR! Observe the following chart to confirm this for yourself . . .
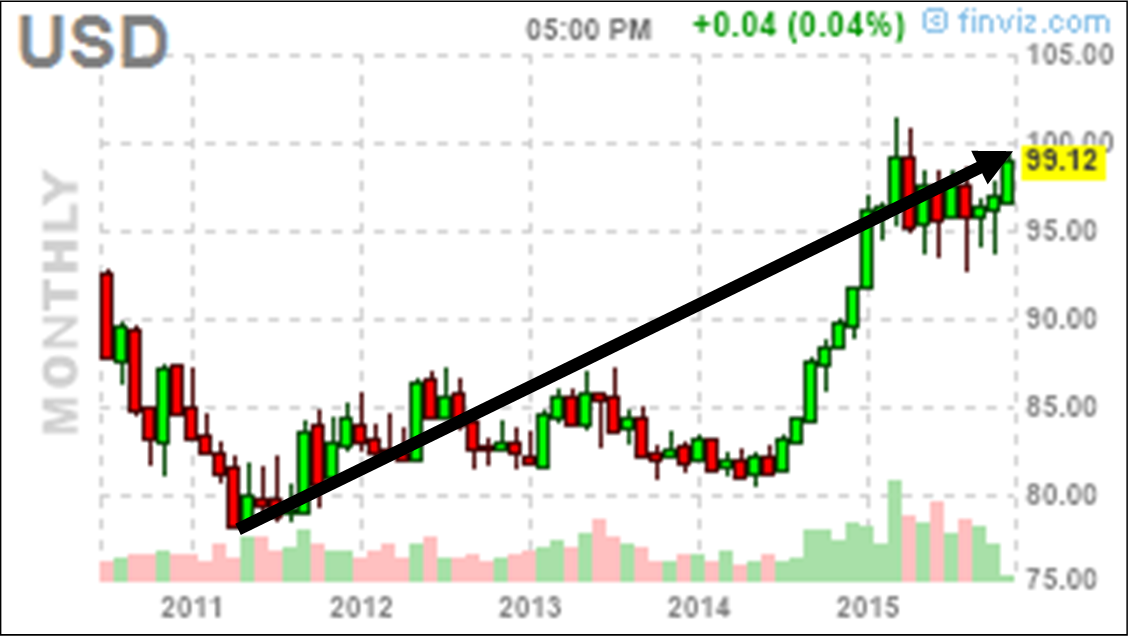
The US DOLLAR has been increasing in value since 2011, not Gold! – George
The combination of a strengthening Reserve Currency AND decreasing prices for Metals priced in that currency is creating Global Deflation and competition for lower prices everywhere. – George
Watch the Eur/usd! . . .
Watch The EUR/USD; Something’s Brewing!
Click Chart to Enlarge for Clarity
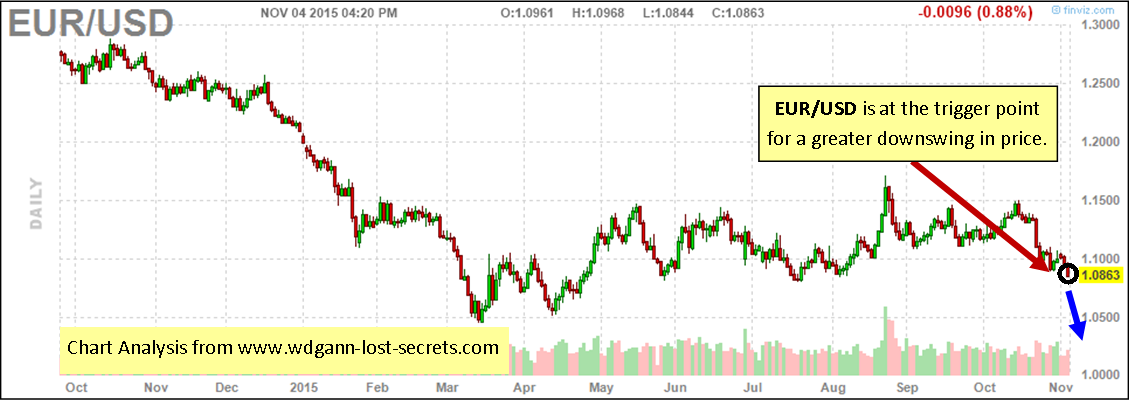
As with GOLD yesterday, there are now indications that the EUR/USD is about to drop again.
Price is now in a volatile trigger or pivot area and the trend strength built up over the past several months has been eroded away.
A slight pull to the downside in price will likely cause the avalanche to start. With so much upside momentum dissipated, the previous major downtrend can reassert itself bringing prices downwards and taking out the lows of last March. – George
GOLD Triggered Downtrend Ahead?
We’re Looking at a GOLD Triggered Downtrend Ahead . . .
Click Chart to Enlarge for Clarity
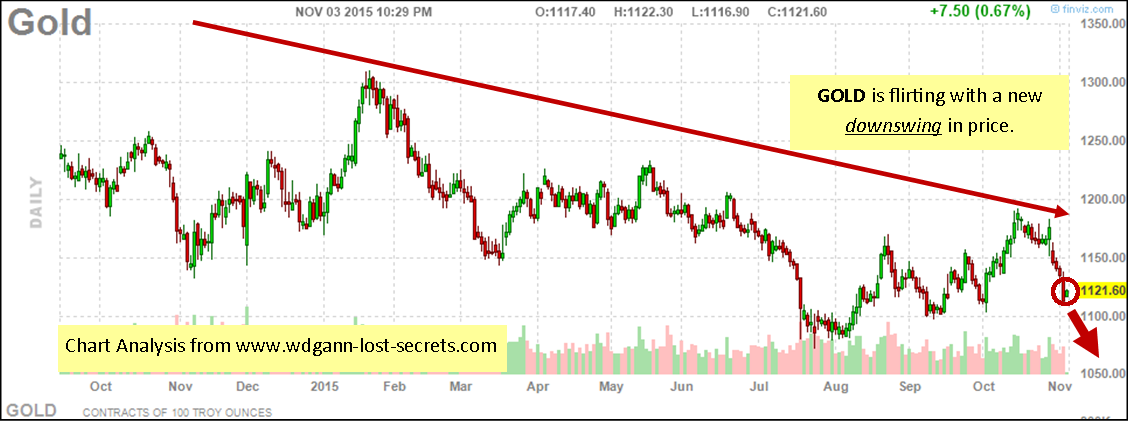
GOLD has recently bounced back from it’s downtrend resistance line and has also triggered a signal indicating even more weakness in price.
The chart tells much of the story . . .
The red-circled price area indicates a critical pivotal price area for GOLD.
Breaking below this price region further will likely lead to taking out the lows of last August and, $1100 will be the first test support area followed by $1055 should prices break through this support.
The price trend for GOLD still remains bearish and will continue to be unless prices can surge and break above $1175 this week. – George
Crude Oil Down Trend Continues
CRUDE OIL TRENDS DOWNWARDS AGAIN
Although the shift took place a couple of trading days back, the market has now confirmed that it’s breaking downwards again in trend.
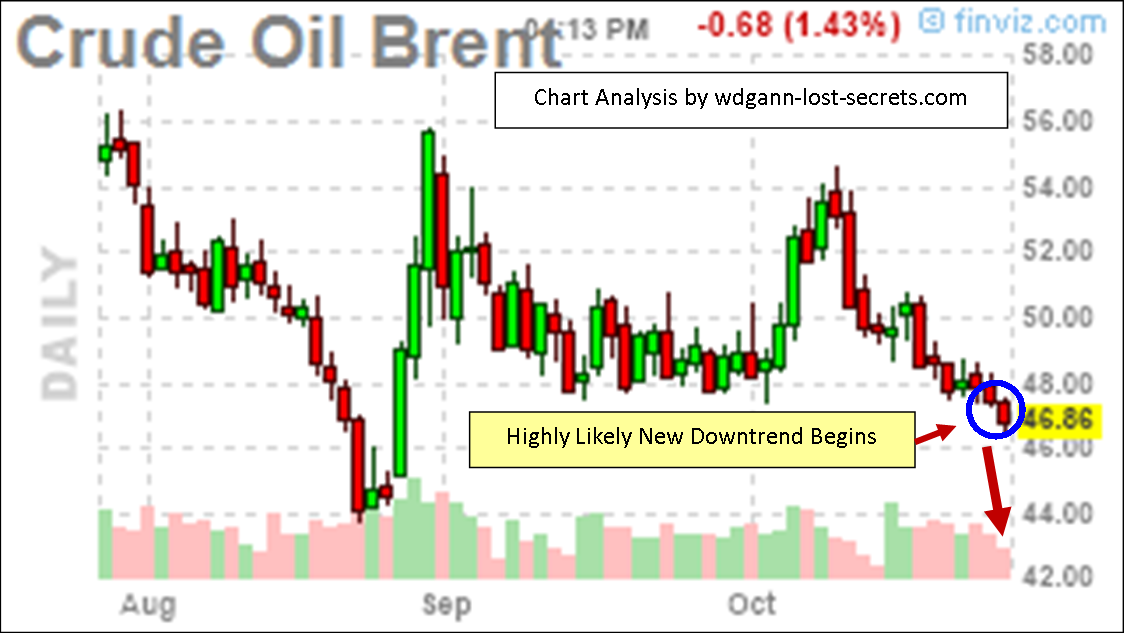 Here’s what it looks like on a price chart with annotations on where the confirmation took place.
This time down, we may take out the August lows and that support level needs to be given a good deal of weight.
If the trend carries through, then, we should see some price support at the $43-$44 level.
The present price angle of descent is below 45 degrees further signifying a weak market and a lack of buying support at present.
At this point price would have to go above the $52 level to assume a more bullish trend again.
Below you’ll find a lower-cost way to follow the Crude Oil Market by using the ETF symbol USO or it’s options:– George
S&P 500 Pivot Point
STOCK MARKET AT IMPORTANT PIVOT POINT
The Stock Market is now at an important pivot point in price.
As described in my post from some months back (see the August 29th post), the ‘unimaginable’ event (a rising stock market which hardly anyone proposed at that time) has, not only occurred, but, is now on the verge of accelerating even higher and faster.
 Despite all the doom and gloom among the average investors (and actually, because of it), the big money has positioned themselves for the unexpected; a strong upwards price movement with absolutely no fundamentals to justify it in the minds of ‘logical’ investors.
Of course, logic left this market scene long ago, but most still believe it to be there and that ‘logic’ would never lead to expectations of a higher market.
Most investors have been standing with their mouths open and eyes fixed like a deer in the headlights gazing at the impossibility of it all and shaking their heads as prices keep moving higher.
‘Haven’t they been reading the News?’
Not to worry though.
There’s still a chance that this market will weaken and come back down but that all depends now on what the market does next now that it has encountered this particular price level on Friday’s close.
As the chart I’ve provided here shows with the blue circled price candle; we’re now at an important price point for this important market indicator.
Should prices break upwards and maintain that upwards bias during the day Monday in the US Market hours, then, we’re very likely to see the beginnings of a very strong price campaign upwards in price.
Forget the news. It’s irrelevant in these market conditions. We’re reading the signs of the market itself here and news is a lagging indicator at best in this market.
As mentioned earlier, if prices can’t break out above Friday’s high, then, a new price slide will emerge.
The downside is not the way to bet this time though, and, this is a lower-risk point from which to stake one’s price direction preference. – George
Selected GOLD Trade Successful
The Selected Gold Trade for Oct. 8th was Successful.
Our Report released late on the 7th of October yielded +$750 in potential returns based on the parameters of the report and the stop recommended.
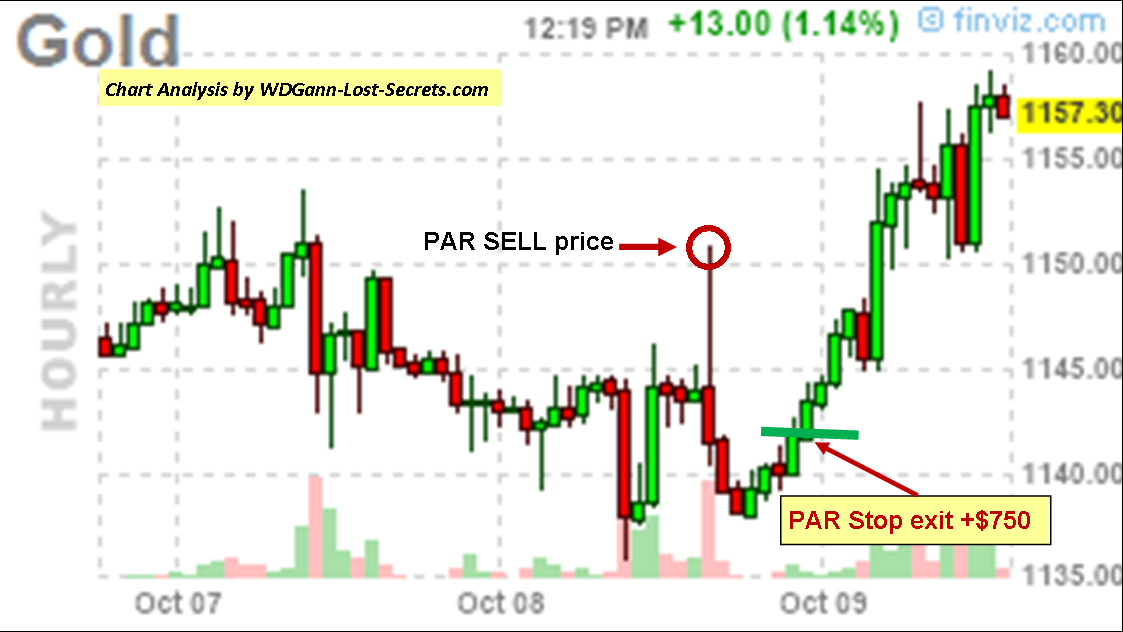 It was an interesting, short-term trade which has since reversed right from our Stop point to go higher by another $1,500 per contract.
The process is more important than any individual or this particular trade.
A trader who was fortunate enough to have purchased ‘The Stairway Trading Method’ would have had enough information to closely duplicate this trade for themselves.
Take control of your own destiny. Contact george@wdgann-lost-secrets.com for availability and price for this technique and my other courses.- George
PAR US Edition
The PAR Report: US MARKETS
Results for: 9-20-15 Report
Trade Closed Out Profitably Within Only Two Day’s Time.
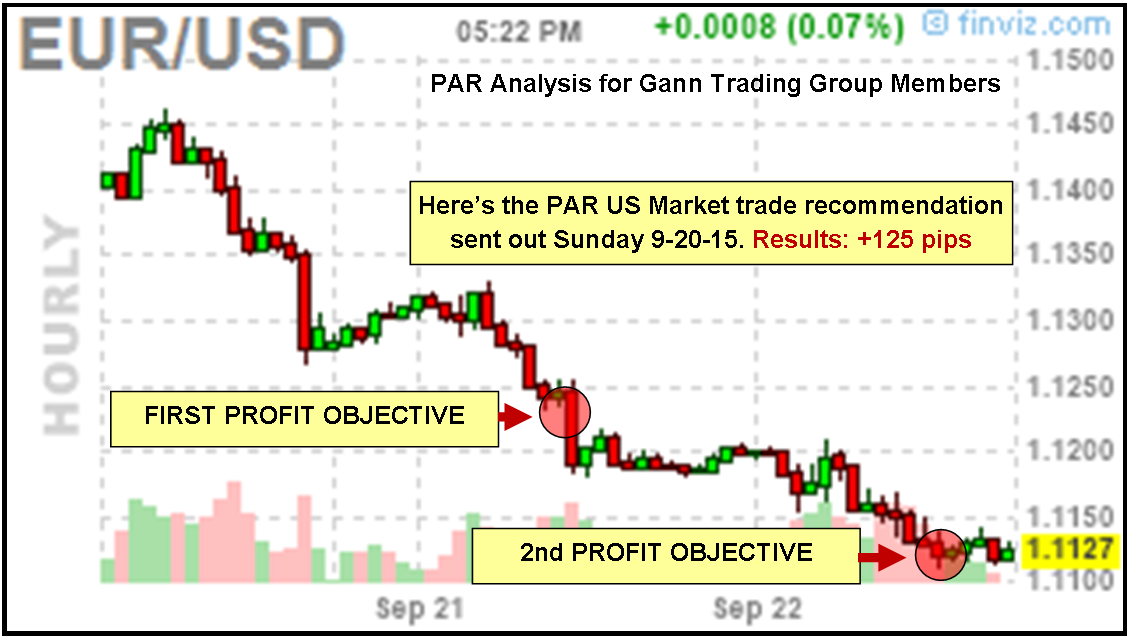 BOTH the FIRST AND SECOND Profit Objectives were met on Monday & Tuesday this week for our Members with a EUR/USD trade.
This was for a total of 125 pips or $1,250 per full contract. Cost of trade recommendation? Only $37!
Only Members will have access to these type of trade opportunities which are based on extensive research and discoveries that took over 45-years to reveal.
You become a Member immediately upon purchasing one of the PAR Reports ($37 for the US Market Edition; $7 for the Indian-Asian Market Edition) and will receive the trade of the week research results automatically upon payment.
There will be one, or more, reports each week drawing on the many market possibilities shown HERE on this page.– George
PAR India-Asia Edition
THIS WEEK’S RESULTS
PAR Members Report: India-Asian Edition for: 9-20-15
All Trades Closed Profitably.
*For the USD/INR Trade: Profit Target was met by Monday: +265 pips
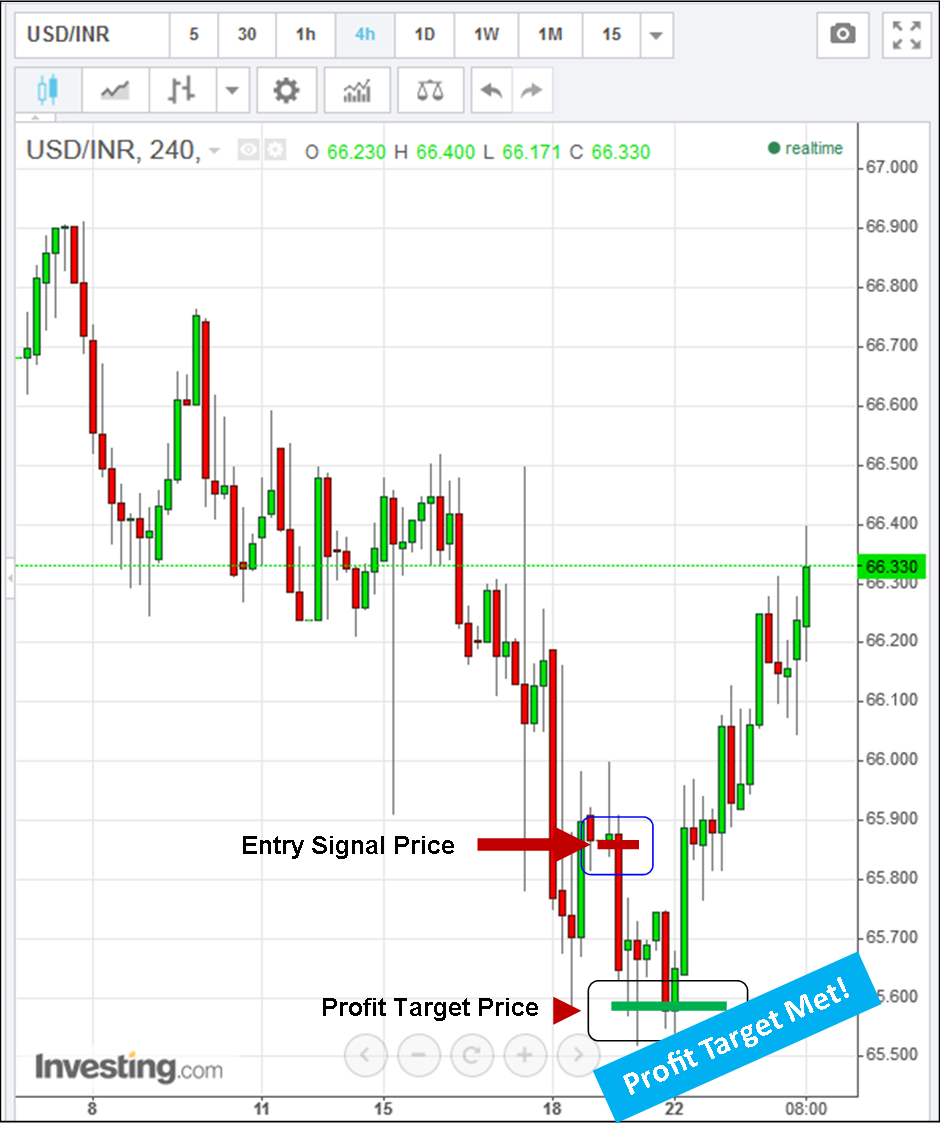
*For the Nikkei 225 Trade: The Profit Target was met on Wednesday: + $125
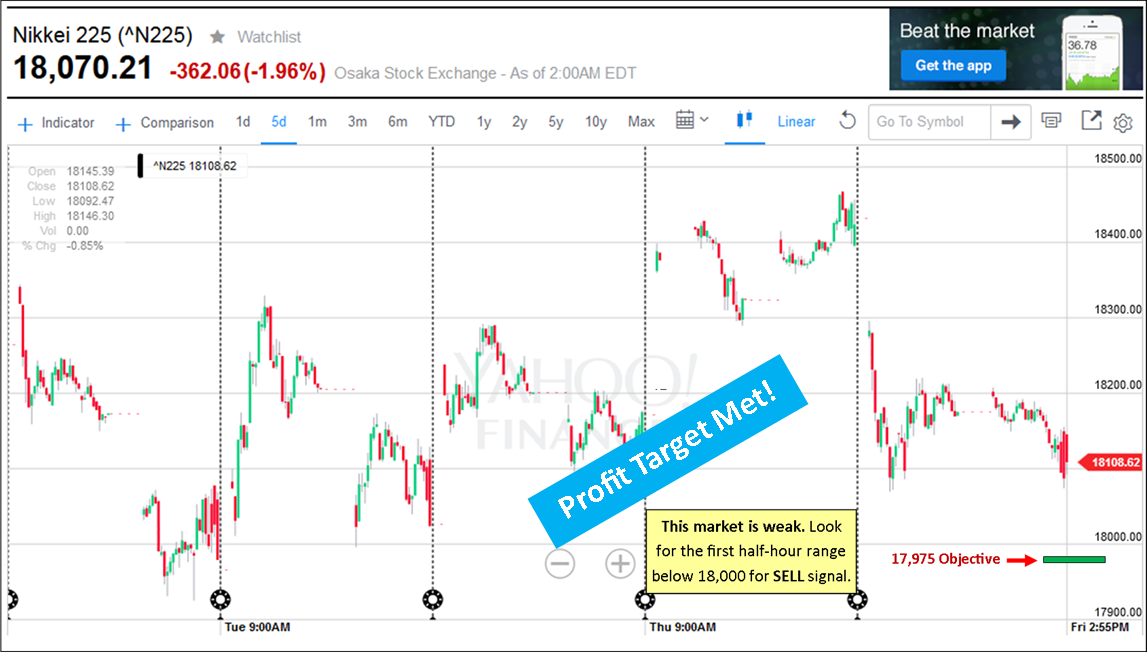
Cost of these profitable trade recommendations? Only $7!
Gold Profit Objective Met . . . Twice!!
LAST WEEK OUR PRIVATE MEMBER’S GROUP SAW THIS CHART FOR GOLD . . .

THIS IS WHAT HAPPENED IN THE DAYS FOLLOWING . . .

OBJECTIVE MET!
FOR MEMBER-EXCLUSIVE ACCESS & MORE DETAILED VIEWING:
 CLICK HERE TO SUBSCRIBE
. . . . . . . . . . . . . . . . . . . . . . . . . . . . . . . . . . . . . .
Last Week’s Gold Objective Has Been Met
NEW UPDATE: 9/11/15
. . . . . . . . . . . . . . . . . . . . . . . . . . . . . . . . . . . . . .
Our Gold Price Objective of $1100 Was Met . . . Twice!
Gold performed as expected and gave us a $1,000 price move (per contract) in one week’s time. The predicted support price has held twice to date. – George
————————————————————————————————————————-
NEW WEEKLY Private Analysis Research REPORTS COMING!
Special trades like these will be offered regularly to our Private Members once to two times per week in the near future on a pay-per-report basis.
YOU MUST JOIN TO BE ELIGIBLE FOR THIS PROGRAM. You may join here for FREE.
Using the pay-per-report program, you’ll only pay for reports when you wish to trade and not during those times when you’re out of the markets.
There will be two varieties available:
- US Markets, where we’ll draw on the best opportunities as they present themselves. The anticipated special, introductory membership price for the US Markets will be $37/Report.
- Indian & Asian Markets for our many followers in those areas of the World. Write me here for the member price for these markets.
If you’re looking for a limited number of specially selected, high profit opportunity trades detailing . . .
- Trends,
- Price Objectives,
- Stops,
- As well as Entry and Exit Points derived from my proprietary published AND Unpublished work, then, these services may be just what you’ve been seeking.
Please drop me an e-mail here so that I can gauge your interest and the markets you’re following. I’ll be glad to put you on the contact list when we’re ready to go.
AN ADDITIONAL NOTE FROM GEORGE . . .
FALL SPECIAL: I’m making The Stairway Trading Method available separately from the Master Trading Course for a limited time.
This unique method of market analysis WHICH IS TRULY DIFFERENT FROM ALL OTHER TECHNIQUES has been withdrawn from public access for several years and, is now updated and more powerful than ever. LEARN MORE>
I’ve personally set aside just 15 copies of The Stairway Trading Method to share with traders and students for the rest of 2015, so, act today and contact me by e-mail here if you’re interested and want to be on the short list of purchasers and owners of this startlingly accurate methodology.
Good for all markets and all time frames and unlike anything you’ve ever seen before in both approach and results. – George
Gold Glimmer Gone?
IF YOU WERE A MEMBER . . .
. . . YOU’D BE SEEING OUR LATEST CHARTS REPORTS RIGHT NOW!
FOR MEMBER-EXCLUSIVE ACCESS & MORE DETAILED VIEWING:
CLICK HERE TO SUBSCRIBE
. . . . . . . . . . . . . . . . . . . . . . . . . . . . . . . . . . . . . .
Gold’s Glimmer Gone?
NEW UPDATE: 9/4/15
. . . . . . . . . . . . . . . . . . . . . . . . . . . . . . . . . . . . . .
IS THE GOLDEN GLIMMER GONE WITH THE SUMMER?
Despite the public’s propensity for buying Gold, the price charts reveal the truth to those with open minds and eyes to see what’s next in this market . . .
[private_GANN TRADING GROUP]
Further price weakness is indicated by the charts right now and, the only way to break this downtrend momentum would be for prices to surge beyond $1160.
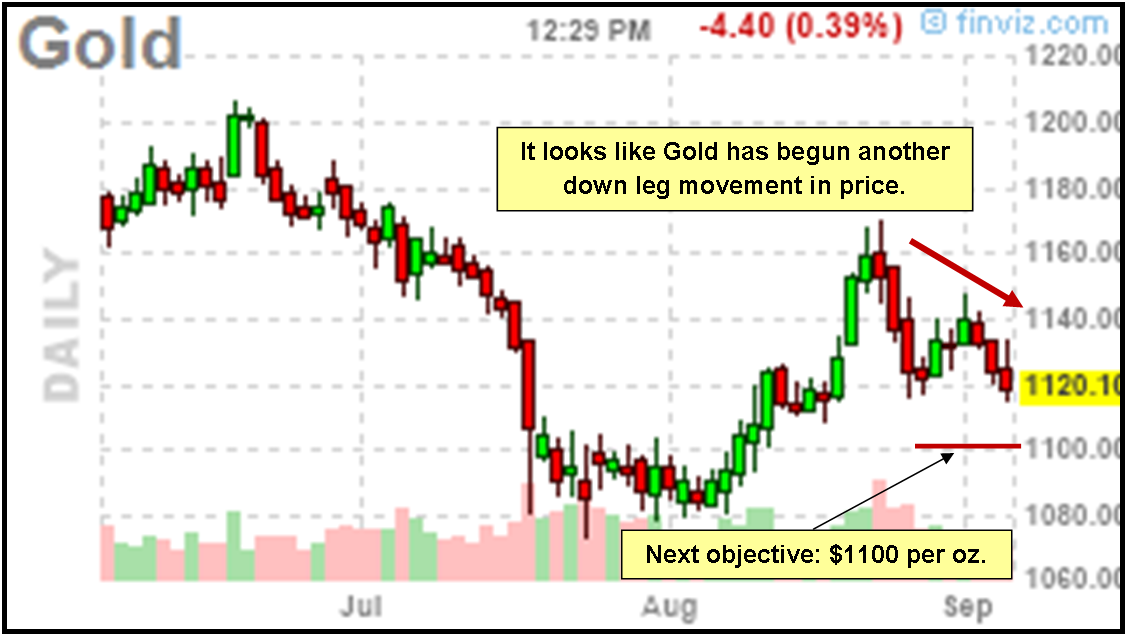 The chart above shows that the present price structure has gone sideways and breaking lower.
New lower prices should come into play over this next week with an early first price objective at $1100. If price is able to overcome the Time element of this coming week and is able to break below the $1100 price level, then, $1080 will be our next expectation on the downside for price support.
A price ‘Run’ is expected this coming week with prices moving sharply in one direction for several days. If such a price run occurs to the downside, it could take prices down to as low as the $1060 level at it’s extreme. There will be a lot of support at this price level. – George [/private_GANN TRADING GROUP]
Fast Rises Yield Fast Falls
IF YOU WERE A MEMBER . . .
. . . YOU’D BE SEEING OUR LATEST CHARTS REPORTS RIGHT NOW!

FOR MEMBER-EXCLUSIVE, DETAILED VIEWING:
CLICK HERE
. . . . . . . . . . . . . . . . . . . . . . . . . . . . . . . . . . . . . .
Crude Oil: FAST RISES YIELD FAST FALLS
NEW UPDATE: 8/31/15
. . . . . . . . . . . . . . . . . . . . . . . . . . . . . . . . . . . . . .
[private_GANN TRADING GROUP]
CRUDE OIL: FAST RISES YIELD FAST FALLING PRICES
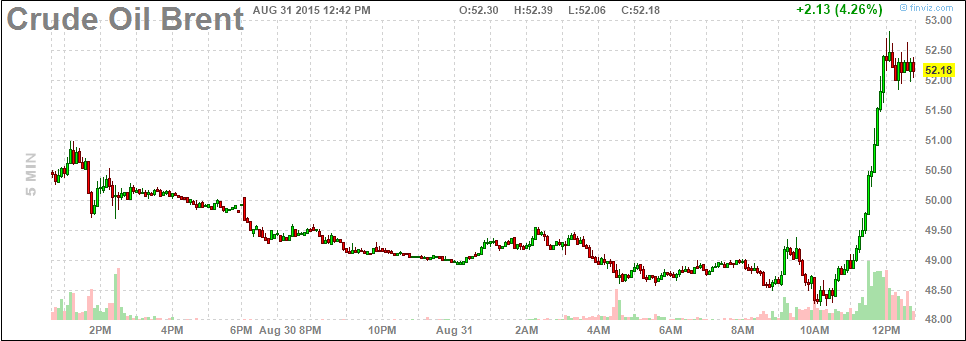 As this is a fast moving market presently, this post will be short and informative:
Long positions in Crude Oil, as mentioned a few day’s back, are going to be very short term positions it appears. The momentum angle for price rise is characteristic of very short-term trends only.
Here’s the present chart for Crude Oil as of this posting time.
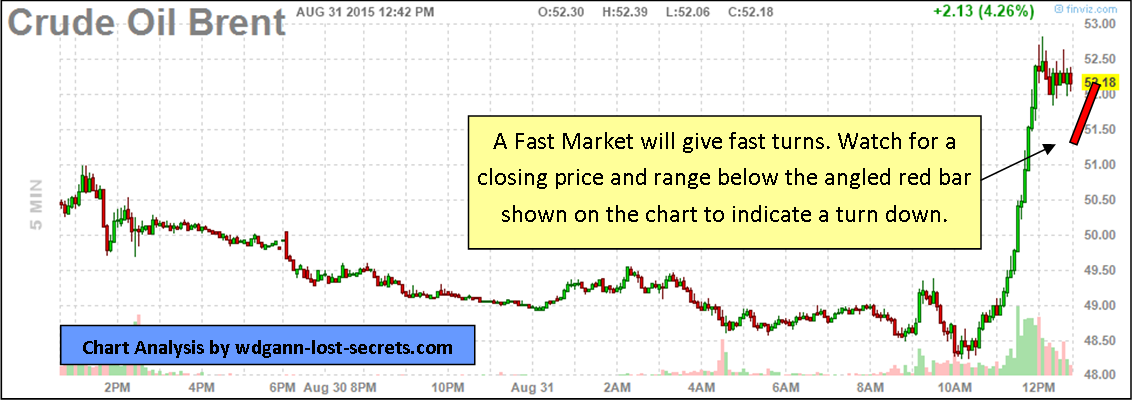 It’s obvious that such a rise in price in so short a time period needs to be absorbed into the market over some time.
A day is simply not enough time for this to take place.
Watch for a sharp reversal in Crude Oil as part of either an absorption period or a complete break to lower lows. – George
[/private_GANN TRADING GROUP]
The ‘Unimaginable’ Stock Event
PREPARING FOR THE ‘UNIMAGINABLE’ STOCK EVENT
(It’s NOT What You May Think!)
[private_GANN TRADING GROUP]
The drift of the media and news has been extremely negative for months now.
The attitude of the masses of investors has been bleak for at least that long, but, because, every one of the above mentioned are part OF the very markets they have formed opinions about, they’re unable to remove themselves enough from their front seat perspective of the markets to get the real skybox view of the totality of the Game that’s in play.
Extract out the Emotion of the news and then the short-term attention span that is prevalent in today’s generations and we can have a better sense of the ‘unexpected’ that is surely coming our way.
Short-term, we were treated this last week, yet again, to an Adrenalin-pumping, market-dropping and white-knuckled event. These type of price events were called a market panic in the ‘old’ days of the last century.
Panics were understood back then to be an inevitable part of a capitalist market; events that had to be dealt with every 6-8 years or so.
The last one was a big one back in 2007, about 8-years ago. But, this one, as of this date, doesn’t even compare in magnitude with 2007-2008!
However, if you were measuring by headlines and furrowed-brows, this one would seem much larger. This is, however, a well-orchestrated emotional slant to events and not what we should, in fact, be looking at, at all.
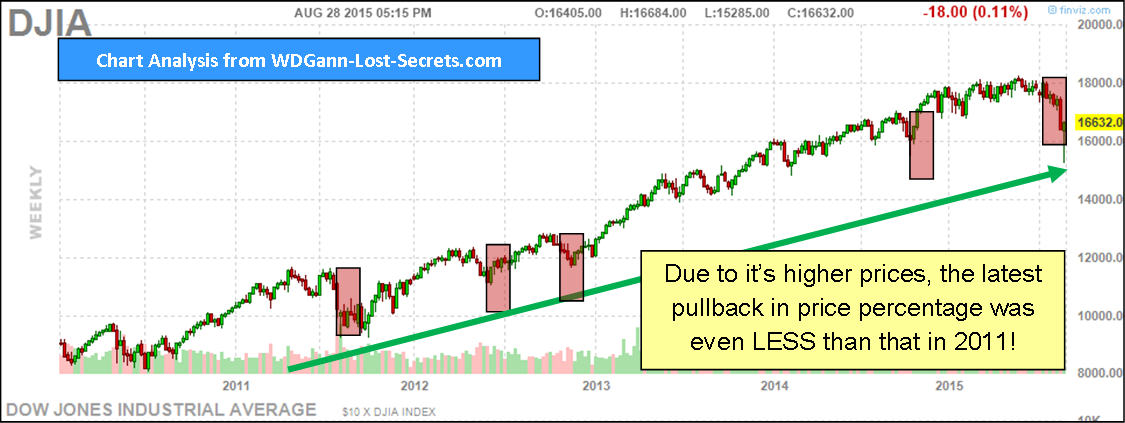
In fact, that’s the point I’m setting out to make here; that this latest market pull-down was NOT out of line with the expected pull-backs at this price level WHEN VIEWED ON A WEEKLY OR ESPECIALLY A MONTHLY TIME PERSPECTIVE.
Not yet, at any rate. Historically, it’s just too early to panic.
In fact, panic being an emotion, we should just go by facts and avoid joining the panicking crowd completely. We have better tools than they do to see what’s really going on out there and that will keep us from the abyss.
And, another point that has bothered me for some time now is that the vast majority of investors are expecting a new dark age of investing conditions. There’s just too many investors with this perspective for it ever to become true on the timetable they expect.
There would be no market or trading if everyone took the same side and, that’s what appeared to have happened here. Everyone seemed to want to SELL.
Well, not quite ‘Everyone’.
Just ask yourself, who would benefit from such a mass exodus from the markets?
The answer is: the Professionals who are shown on the charts here that have been following the consistent UPTREND and who happily BUY on the pullbacks.
It was the immaculate ‘They’, (the Warren Buffet-types of the World), who were, once again, BUYING after letting prices fall as far as possible first.
These were the very same pullbacks where the ‘public’ bailed out of their stocks and retirement plans in order to sell to the eager BUYERS (who are driving this stock market ever higher).
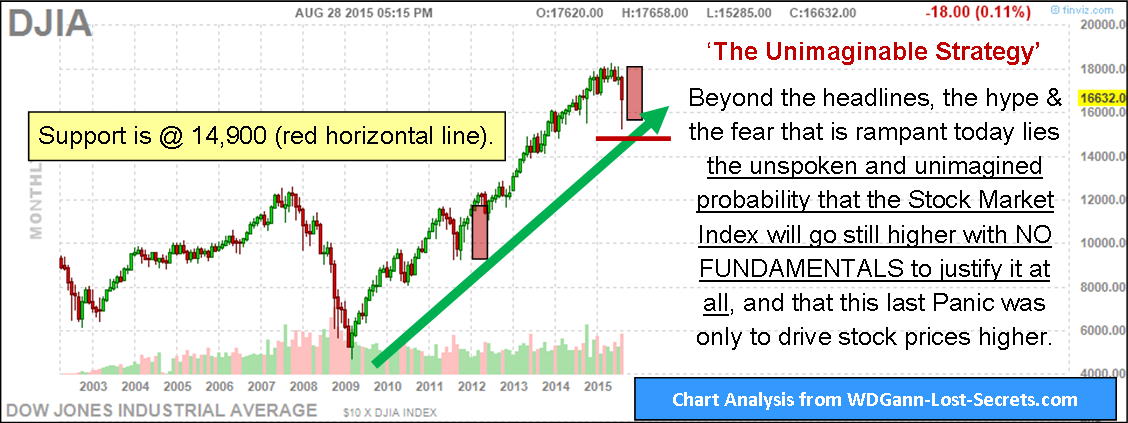 This is the ‘Unimaginable’ Strategy as it seems to be playing out today and which should not be ruled out:
THE MARKET IS LIKELY TO BE GOING HIGHER THAN ANYONE DREAMS OR CAN JUSTIFY.
WHAT??
Well, it’s just that sort of bold & ‘crazy’, counter-public scenario that provides the ‘best fit’ to the present atmosphere and facts. Too many are focused on the downside for it to be possible.
- There’s NEVER been a major stock market crash that was expected by the majority of it’s participants.
- The statistics of the Weekly and Monthly pullbacks don’t identify ANY anomalous pullback percentages.
Don’t misunderstand what I’m writing here. I’m not declaring that the market cannot go lower. Of course, it can, BUT, it cannot without first violating the second fact on our list (the pullback percentages) and other proprietary indicators that have been developed by this site’s owner.
A dropping market will have to reveal itself by violating certain fundamental indicators that are unknown by the public but which are mathematically fundamental. This has not happened as of yet, but, those facts will be monitored and reported to the members here when they’re detected.
YOU’VE NOW BEEN MADE AWARE OF THIS VIRTUALLY UNKNOWN PROFIT POSSIBILITY, IT’S TIME TO ACT ON IT (and prepare for many more such highly probable profitable events to come).
A SPECIAL FALL OFFER:
If you want to be able to follow this ‘event’ as it unfolds and become aware of still others as they emerge from the market ‘noise’, then consider acting today to take advantage of one of my most popularly successful and simple to apply private charting methods. I’m speaking of ‘The Stairway Trading Method‘.
This special FALL OFFER will briefly make available again a trading approach that has been unavailable up to now except to purchasers of the Harrison-Gann Master Course.
Those who have learned this method and applied it have been most satisfied. Indeed, one former hedge fund manager said that this method would have vastly increased his profitability had he possessed it when he ran his fund. He now uses it privately for his own accounts.
The Stairway Trading Method is custom-designed to allow a measured and mathematical approach to both catching shifts in trends but also in allowing one to follow trends in progress while also compensating for sideways, go-nowhere market periods. Those are the very periods when so many traders are ‘tricked’ out of their trading positions prematurely, only to watch them later take off again, leaving them behind to wonder ‘what happened’.
The course is brief, easy-to-learn and quick to apply without a computer or calculator!
Stairway has been updated with more details on how to follow the volatile markets of today.
Full support for the course is available for 24-months along with a secure means of file exchange and communication.
Contact me by email if you are interested or have further questions. – George – wdgann-lost-secrets.com
—————————————————————————————————————————————————————————–
 This is an incredibly simple approach to price charts that uses a unique timing approach to harness the one market constant: The Way People Think.
PSYCHOLOGY – A TOOL FOR BETTER INVESTING
After about 40 years researching the markets, an alternative, easy-to-use technique was discovered to seek out and find critical price trend changes by detecting shifting points in Investor’s Thinking Patterns.
The concept behind this analysis & trading technique is profound and enlightening and I offer it again for those who want an another method of analysis in addition to The Excalibur Method. Consider The Excalibur Method as a finely tuned sports car, while the Stairway Method is a fine Mercedes.
However, everyone else is still traveling by horse and buggy in comparison.
NOTE: I held this method back for several years now to allow previous purchasers a non-competitive edge, but, during these economic times I’ve decided to make the Stairway Method available again for a limited time to members..
SO, WHAT’S IN IT FOR YOU?
This method uses a specific, consistent, reproducible and powerful Subliminal Psychological Principle to determine:
- High-probability Market Buy and Sell price points.
- Stops for investing in trends already in progress.
- Visually detected critical price points.
And, does it using only a simple chart, your eyes and THIS METHOD.
“The Stairway Trading Method” Manual; printed, bound and registered to you by name.
The manual is 8.5″ by 11″, spiral-bound and personally registered to your name.
Please allow 1 business-day to print, bind and personalize your manual.
“The Stairway Trading Method”, was sold privately a few years back for $3,995.
I’m making it available again to members of The ‘Gann Trading Group’ for just [Email me HERE for the special price], and it will be promptly shipped to you by FedEx or FedEx International Priority when you order using PayPal.
Interested? Contact me HERE. Thank you. – George
[/private_GANN TRADING GROUP]