George Harrison

Courage: The Gateway to Trading Profits
COURAGE LEADS TO MARKET PROFIT OPPORTUNITIES
In the midst of gloomy media scenarios, Courage is almost always overlooked as an essential ingredient to lasting success. Cyclical Human Psychology requires us to review what happens during sharply rising markets. Let’s see what we can learn by doing so.
Exponential markets leading, inevitably, to ‘blow-off tops’ are caused and accompanied by market euphoria (extreme optimism) NOT by gloom & doomers.
From personal experience, I can state that I was there at the dotcom peak in 1999-2000. Those were heady days and, I can assure you, no one rang the bell at the top to say it was over.
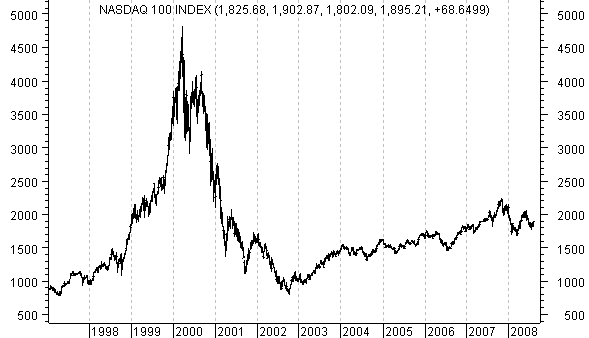
No indeed, in fact, the news remained pretty positive well after the peak (as no one could believe what they were seeing and, instead confused hope for reality).
Today’s stock market is far from looking like this bubble from 1999-2000, and even back then opportunity was there to make huge profits.
OPPORTUNITIES ABOUND; ONLY AWAITING YOUR ABILITY TO RECOGNIZE THEM
First, let’s dispel the ‘good feeling’, ‘no-one’s-at-fault’, ‘life-should-be-fair’, ‘everyone-is-equal’ fairy tale that’s become the bedrock of today’s socialistic education and state what’s TRUE instead.
Here’s the TRUTH: Real opportunities are for the few, not the many.
This is not conspiratorial. It’s Nature’s Law.
Nature provides massive opportunities for the few by providing the greatest percentage of Humanity (and investors) with enough fear-based opinions (that run contrary to opportunity) to well provide for the wealth of the few with the courage to act against the crowd.
The Courageous Act upon opportunity. Yes, they analyze, then, they ACT.
The fearful Think About opportunity (in fact discuss it endlessly in forums, with their friends, etc.), then, Hesitate (calling it ‘prudence’) until it becomes clear that opportunity has passed the by (yet again-‘bad luck’).
COURAGE requires raising oneself above their Human Nature to a Higher Ideal and making this the new Standard.
Here, again is the reality which we must work with:Fear is the default program for Humanity.
It is firmly planted into our lower nature as a survival tool, but, the key to our success lies in rising above our lower nature and not in embracing it.
Fear of others successes also works against achieving our own success.
It’s become common in the press these days to criticize the top 20% income earners, but, in truth, upon closer examination, you’ll find that these are the people who had the Courage to become the top 20% of income earners.
You see Courage isn’t a fairy tale concept as so many of us have been taught.
Courage is a real-life Key to success in Life; in every aspect and, yes, an investing key to success as well.
All of Man’s History shows that cultivating Courage in Life, will elevate oneself to a higher, nobler place and, with that accomplished, it must then reflect in greater Life success and, therefore, sounder financial decisions as well.
Food for thought. Good Trading. – George
![]()
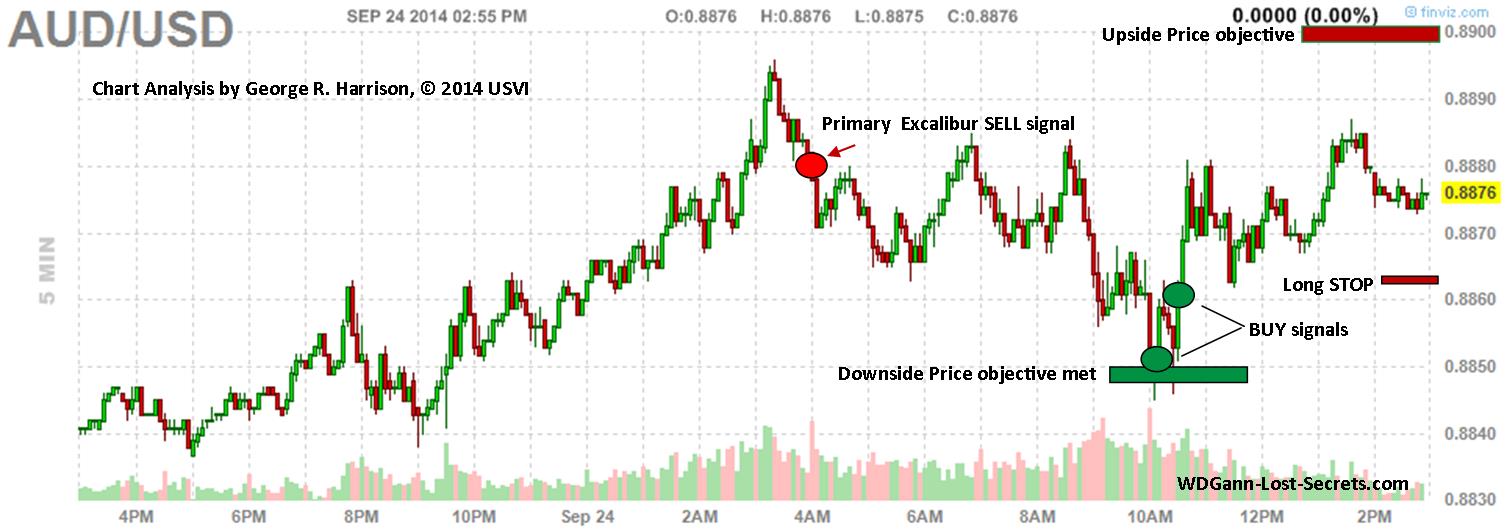
Australian/US Dollar: part 4
PRICE OBJECTIVE MET TO DOWNSIDE
The price objective was reached to the downside and prices have since staged an upwards swing.
This chart is intended for educational purposes only, not an advisory or recommendation to buy or sell.
The chart above shows the current status of the AUSUSD as of this posting.
If you’d like to have access to this type of market analysis, e-mail me here for details. Thanks. – George
![]()
Australian/US Dollar part 3
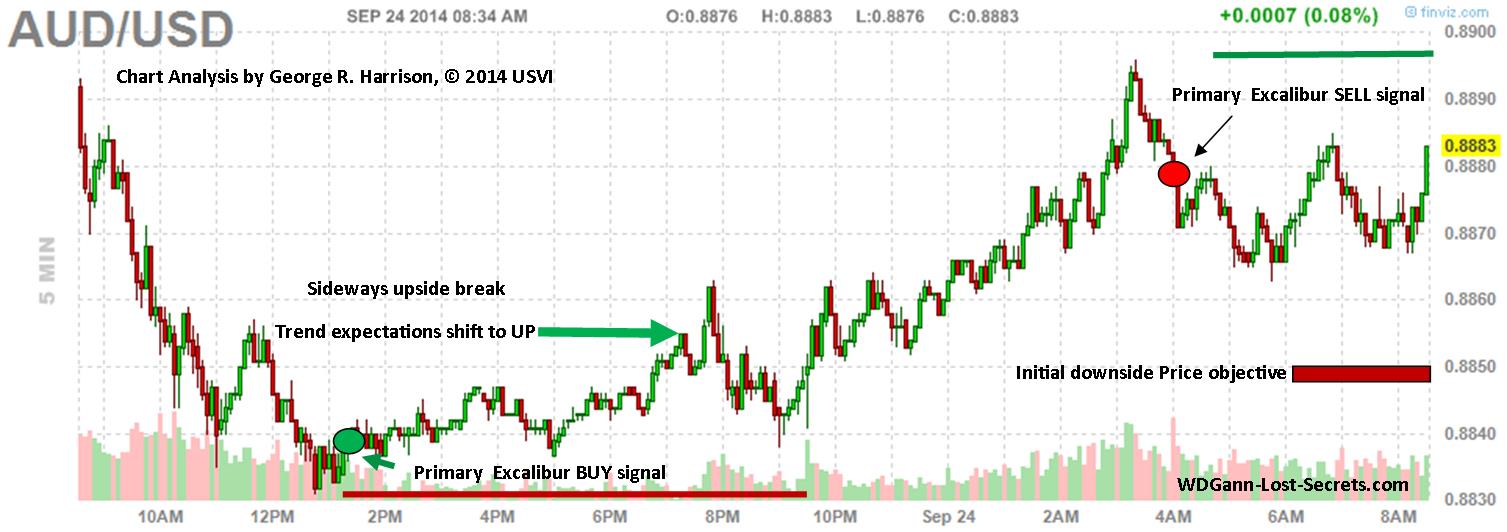
AUSTRALIAN/US DOLLAR HOURLY MOVES: PART 3
Observing the short-term hourly moves in the Australian/US Dollar proves out the principle of scale.We observe the same adherence to underlying fundamental laws at the short-term that we have observed at the daily, weekly, monthly and yearly time periods.
All charts are shown for educational purposes only. This is not an advisory or promotion to buy or sell any trading instruments.
![]()
Follow-up to Yesterday’s AUS/USD Comments
YESTERDAY’S AUSTRALIAN-US DOLLAR CALL
DISCLAIMER: All charts are for educational purposes only and not advisories or recommendations for trades.
This is a follow-up to yesterday’s hourly observations and expectations for a rise in the AUS/USD.
Happily, this is exactly what happened over the intervening hours with two tops put in that the Excalibur Method’s primary indicator (shown by the red dots on the chart below) pinpointed nicely yet again. Let’s look at the chart:

DISCLAIMER: All charts are for educational purposes only and not advisories or recommendations for trades.
The green arrow shows yesterday’s expected price trend direction.
Prices did indeed go upwards, double-top and then take out the expected lows to continue down.
The present expected down trend is shown by the red arrow.
Momentum has slowed after reaching a solid support level and must drive below the 8830 level to proceed downwards further.
Until then, a repeat of yesterday’s action with the hourly trend trying to make a stab upwards out of it’s sideways trend is not out of the question. Should price fail to muster enough energy to do this, then, a slide down to the next level can be expected overnight as a continuation of the expected trend direction. – George
![]()
Hourly Chart Watch: Australian/US Dollar
SHORT-TERM CHART WATCH FOR THE AUSSIE/US DOLLAR
Here’s a close-term look at the hourly trend in the Forex AUSUSD.
 Momentum is now building as accumulation is under way short-term. Watch for breakout from the green rectangle price area.
The price support is indicated by the red horizontal line. If price breaks below this level, the downward momentum will resume in earnest.– George
![]()
The Invisible Shift in Gold & Silver’s Real Value
DISCLAIMER: All charts are for educational purposes only and not advisories or recommendations for trades.
OVERLOOKED BY ALMOST EVERYONE:
THE ‘TRUE’ SHIFT IN GOLD & SILVER’S VALUE
 There’s constant shock in the media and from the precious metals crowd whenever a new round of lows in price are reached.
This amazement on their part, unfortunately, reveals a real lack of historical price study and a missing contemplation about what is really happening in the World today relative to the ‘precious’ metals.
What is the “BIG” Picture relative to the precious metals anyways?
The standard theories have failed for decades yet, millions still cling to them for lack of a better model.
I’d like to humbly submit the following as a ‘missing’ perspective that should be given some thought relative to Gold and Silver.
This different approach stems from decades of following the serpentine trail of WD Gann which certainly taught me that the ‘obvious’ is often obscured by the popular mindset and ‘leaders’ of the industry they purport to be expert in.
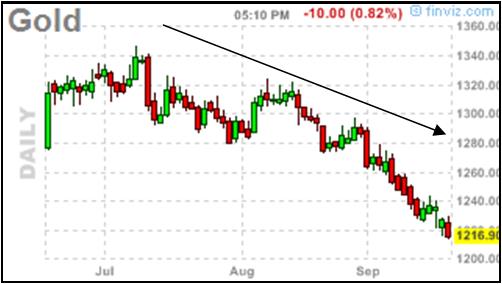 The truth is that ‘precious metals’, are fated to become a lot less precious in the near future.
What do I mean by that statement? Just this: while promoters were extolling the virtues of owning Gold and Silver for decades, it had gone (conveniently?) unnoticed that more and more individuals now held some Gold or Silver of their own.
All this while the Chinese and Indian populations were massively purchasing more and more every day.
In short, in the very process of so many people buying and holding Gold & Silver, these metals have become more common and less ‘precious’ than ever before.
The gold promoters for years have pressed the scarcity of gold and silver as their main reason for expecting higher and higher prices.
Even as prices peaked in 2011 they refused to believe that Gold or Silver were still, in the end, just commodities and would decline just like the other commodities which also peaked around that same time period.
But, even beyond this fundamental, historical fact, the truth was that more gold & silver were produced and delivered to meet demands of the public even as prices fell.
The simple fact is that there’s now more gold and silver in the hands of the public than has been true since 1963 (when silver coinage was in circulation in silver’s case) or 1931 (when gold coins were in circulation in gold’s case)! Just on the basis of population growth since these past years, this would be true.
And, in those days Gold was far cheaper ($34 an ounce) and Silver was a dollar an ounce.
Yes, we have fiat inflation today and those prices don’t seem even possible, but, then, when Silver was around $50 an ounce just a few years ago, who’d expect the $17 an ounce range we’re in today? Or the $700 drop in Gold prices from their highs?
Even trillions of dollars of inflation with the QE programs failed to prevent Silver and Gold’s decline; such must be the increased quantities of both to account for this.
If one viewed gold and silver like a cell phone that didn’t add improvements every year, but, which stayed the same year after year while millions more were sold each year, you’d know instantly that the resultant retail price value trend of that cell phone would go down, down and down as more people owned one.
Gold and silver add no improvements to their value, ever and millions more units are brought into circulation every year and more and more people purchase those units.
Why should prices stay up?

As more come to possess it, logic dictates it would have to continue to lose it’s value until it reached a point of equilibrium with demand and supply.
Gold or Silver are not rare and are valued by the masses because they are obtainable (unlike rare earths, which truly ARE rare). So, don’t be hypnotized by the press and learn to think for yourselves.
That’s our main goal here; to remove myths and pick the trading trends for markets up or down.
One should have no fixed viewpoint about gold or silver or their price direction or the belief systems around them.
It’s not necessary or helpful to hold too tight to an outlook for markets unless you can back up the opinions with sufficient historical precedent to solidify one’s outlook.
One can find profit opportunity in falling as well as rising markets. In fact, money accumulates faster in downward moving markets as they tend to move much faster.
My goal here is to teach those who would not be swayed by opinion in how to determine what the true market conditions are.
The purpose behind the Excalibur Method and the other modules within the Harrson-Gann Trade Secrets Master Course are to free one’s mind from unsupported opinions and to let the markets speak clearly in their own language.
The markets will reveal their intentions to those who are trained in how to listen.
The underlying Truth about markets is all that matters in the end as only that truth will guild one to success by following the market’s lead and not fighting it. – George
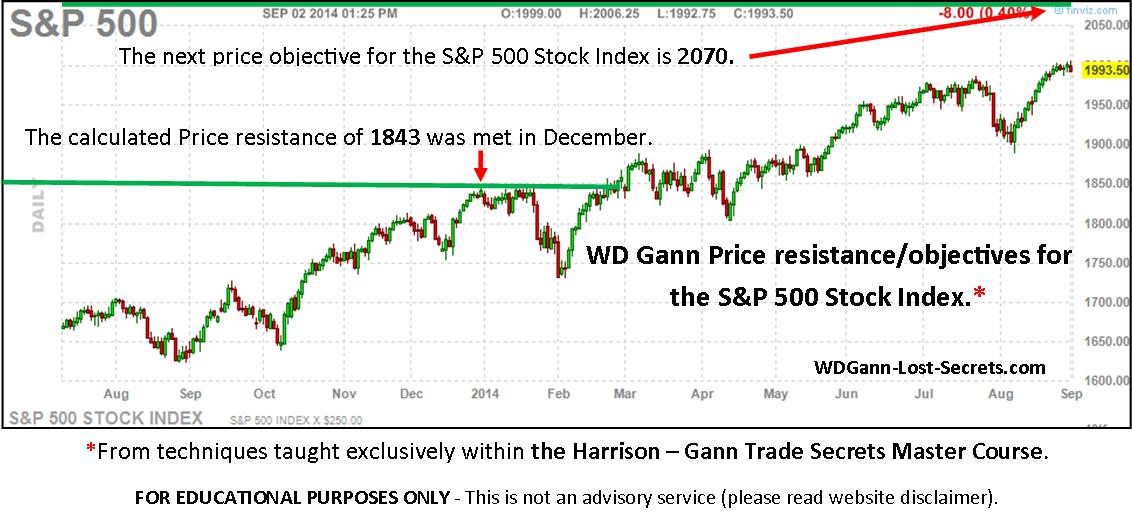
Core Principles Work at Every Time Level
THE SAME PRINCIPLES APPLY NO MATTER WHAT THE CHART TIME FRAME

Core Principles of the Markets work at every time period. – George
DISCLAIMER: The chart is for educational purposes only and is not an advisory or recommendation.
The techniques that give the result seen on these charts did not just come from conventional theories or tools, but from decades long research, high costs and testing. If you wish to save yourself both time and money, consider becoming one of the few students left this year who will have access to the Harrison-Gann Trade Secrets Master Course or the Excalibur Method (which may be purchased separately). – George
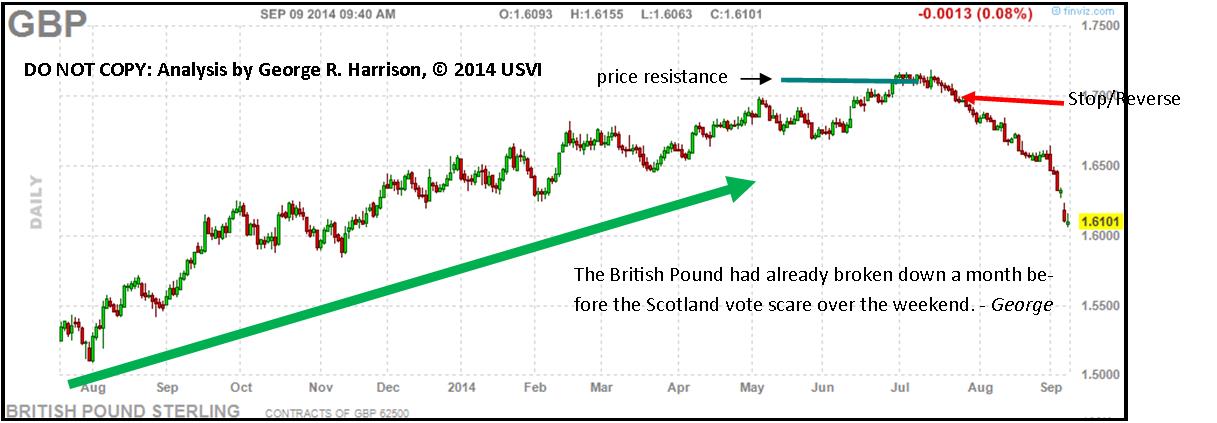
The Pound’s Decline: Already ‘Baked-in-the-Cake’
DISCLAIMER: The chart is for educational purposes only and is not an advisory or recommendation.
THE BRITISH POUND’S DECLINE WAS SEALED A MONTH AGO
Several of the important ‘Core Principles’ (the term used to describe our personal working template for detecting and analyzing the latest international market opportunities) aligned over a month ago to confirm that a top was occurring.
While the World only came to this conclusion over the weekend (with the shock about the Scottish Independence vote going against England), the best positioning was back several weeks ago to take advantage of the slide to come. As is usually the case, there was no news back then to offer a clue.
That’s why one must have access to superior analysis techniques or services in order to act when there is no crowd or emotion at play.
For those unaware of rarity that they’re viewing with this and, especially the chart in the private member’s area, please understand that this combination of Analytical factors hasn’t been seen or employed this effectively in the markets since WD Gann’s day.
To view BRITISH POUND (GBP) chart going forward from here (using these same ‘Core Principles’), you must become a member of The WD Gann Trader’s Group.
A SPECIAL SERVICE FOR MEMBERS ONLY
(The ‘WD GANN TRADER’S GROUP’ is temporarily Free to JOIN HERE TODAY)
[private_WD Gann Trading Secrets Group]
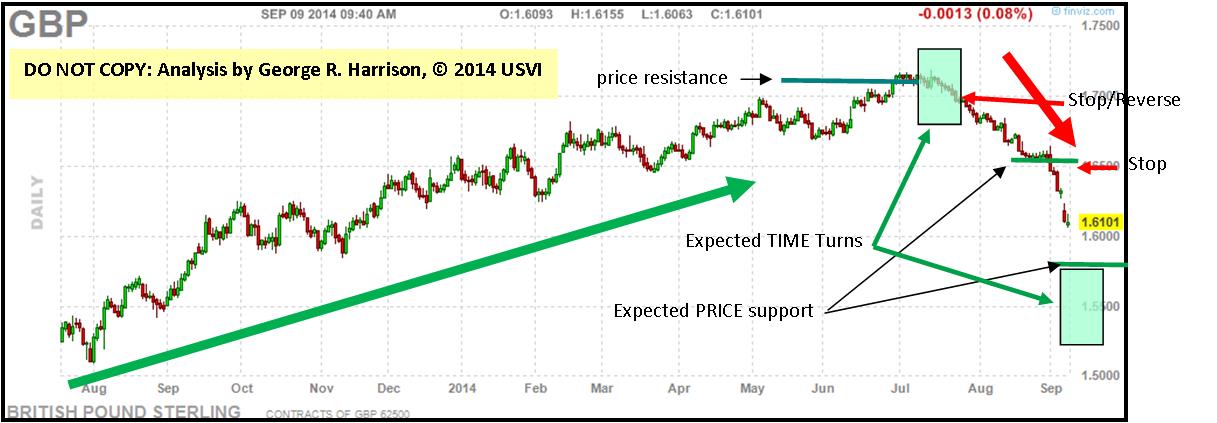
A ‘CORE PRINCIPLES’ TRADING APPROACH TO THE BRITISH POUND
You’ll note on this special chart, the past and future support price levels, the expected turn time periods and stops.
The methodology for how these calculations are done are not provided on the charts. Special techniques included within the Harrison-Gann Trade Secrets Master Course will help students find most of these same critical points for themselves.
This new addition to the private portion of our website is introduced for the benefit of those who wish to view today’s markets in the light of these latest discoveries and the market’s natural laws as did WD Gann. The example chart above shows how these component ‘core principles’ work when applied to the BRITISH POUND market.
DISCLAIMER: The chart is for educational purposes only and is not an advisory or recommendation.
The ‘Core Principles’ approach is all inclusive in determining high probability price levels of Support, Resistance, Tops, Bottoms, Markets of highest rates of return and Expected times for these events to occur. These charts are limited to the private membership of the WD Gann Trading Group (a private, membership club). They are NOT a public offering.
I’ll include more examples of this mode of analysis in the future. – George [/private_WD Gann Trading Secrets Group]
Entry & Exit Points
‘CORE PRINCIPLES’ ALSO DEFINE ENTRY & EXIT POINTS
Referring to the CORN chart in our previous post lower on this webpage, there is another ‘Core Principle’ that is critical to a successful capture of price move and, that is ‘Timing’.
In order for the other principles to work in harmony, there must be tools to determine when price pressures are building for an uptrend or breaking down for a price slide.
For the CORN market, I’d like to direct your attention backwards to the post of MARCH 6th, 2014 where both the Prediction
AND the title was ‘UPTREND IN CORN’ and the chart posted was this:

The timing was a perfect point to get on board a trend that others never saw coming. This market eventually developed into the chart we view next.
 The uptrend was short-lived, but, importantly, when the signals indicated that the top had been put, this turned out to be critical point to go short and capture a large decline in CORN prices. – George
WD Gann’s Secret ‘Core Principles’ Still Work Today
DISCLAIMER: The chart is for educational purposes only and is not an advisory or recommendation.
A ‘CORE PRINCIPLES’ TRADING APPROACH
‘Core Principles’ is the term used to describe our personal working template for detecting and analyzing the latest international market opportunities. This trading philosophy focuses the latest of my private market research discoveries with the best of the Harrison-Gann Trade Secrets Master Course work into a unique approach for detecting and analyzing market opportunities. This combination hasn’t been seen or employed since WD Gann’s day. In fact, the last time that many of these concepts were last used was by Mr. Gann himself as evidenced by his working papers.
To view the following ‘Core Principles’ chart, you must become a member of The WD Gann Trader’s Group.
A SPECIAL MESSAGE FOR MEMBERS ONLY
(The ‘WD GANN TRADER’S GROUP’ is Free to JOIN HERE TODAY)
[private_WD Gann Trading Secrets Group]
A ‘CORE PRINCIPLES’ TRADING APPROACH
‘Core Principles’ is the term used to describe our personal working template for detecting and analyzing the latest international market opportunities. This trading philosophy focuses the latest of my private market research discoveries with the best of the Harrison-Gann Trade Secrets Master Course work into a unique approach for detecting and analyzing market opportunities. This combination hasn’t been seen or employed since WD Gann’s day. In fact, the last time that many of these concepts were last used was by Mr. Gann himself as evidenced by his working papers. Here’s what the ‘Core Principles’ encompass when analyzing the markets:
- Projected natural support and resistance price levels.
- Natural-Law-based stops.
- Expected times to turns in the market.
- Selecting the greatest potential rates of return.
This new addition to the private portion of our website is introduced for the benefit of those who wish to view today’s markets in the light of these latest discoveries and the market’s natural laws as did WD Gann. The example chart above shows how these component ‘core principles’ work when applied to the CORN market.
DISCLAIMER: The chart is for educational purposes only and is not an advisory or recommendation.
However, I’m sure you see the point. The ‘Core Principles’ approach is all inclusive in determining high probability price levels of Support, Resistance, Tops, Bottoms, Markets of highest rates of return and Expected times for these events to occur.
Those group members interested in having these ‘Core Principles’ applied to their own investments should contact George@money-tigers.com.
This will be limited to the private membership of the WD Gann Trading Group (a private, membership club). It is NOT a public offering.
There will be more examples of this mode of trading in the future. – George [/private_WD Gann Trading Secrets Group]
WD GANN: The Grander Perspective
WD GANN: TAKING IN THE GRANDER PERSPECTIVE OF THE MARKETS
One of the pleasures of the long-fought battle to understand the concepts that WD Gann used during his career, has been the ability to watch price movement unfold in an understandable and predictable manner.
A picture is worth more than ten-thousand words in this regard and, you can tuck the following chart away for consideration going forward into the fture.
Palladium: While Investors Were Sleeping
WHILE MOST WERE COUNTING THEIR GOLD COINS
 OR WATCHING THEIR STOCK PORTFOLIOS,
PALLADIUM WENT ON TO BRING IN THE BEST PROFIT PERFORMANCE OF THE YEAR!
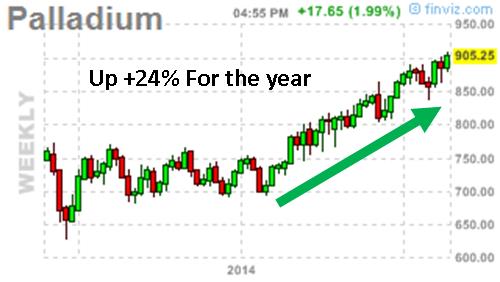 Further proof that one must not become wedded to a single market and, that it’s necessary to have a technique that can distinguish the rates of growth or intention for each individual market. You’ll find this with The Excalibur Method as well as with the rare techniques & methods revealed within the pages of the Harrison-Gann Trade Secrets Master Course. Learn more about them on this website or e-mail george@money-tigers.com for price and availability of the courses. – George
Big Players Want You Out of the Stock Market!
ARE YOU BEING MANIPULATED INTO EXITING THE STOCK MARKET TOO EARLY?
Someone ‘out there’ doesn’t want you to be invested in the stock market.
They want you to be afraid of an impending crash in the market, fearful of the Economy, foreign affairs, wars, etc., etc.. And, this propaganda program has worked quite well to scare the average investor clean out of the markets.
How?
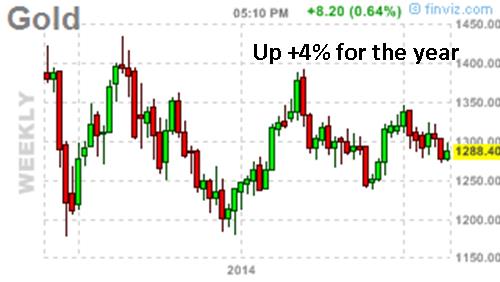
Much like those who refuse, even at this late date, to acknowledge that GOLD is a declining market not an inclining one, so too have most investors maintained their expectations for an immanent crash in THE STOCK MARKET even as stocks have risen month after month to new higher highs.
As usual, it’s not your fault.
Instead, investors have been exposed to a constant drone of prognostications predicting doom and gloom for the stock market. The
expectations for an immediate crash have been the daily diet for financial news junkies for years now.
At some point, one should ask: “How much money has this kind of advice made me so far?”. The short (and accurate) answer is zero.
In fact, this type of advice has been more harmful in that it has caused millions of dollars of lost opportunity.
Investors have stayed away from these types of investments and lost the opportunity to participate in the large percentage gains that have come and gone along the 3ay over the last years that this fear of market crashes has been promoted.
The latest version of this is the so-called “news” that now, the ‘guru’ George Soros has gone short the stock market expecting a crash.
Let me say that having watched Mr. Soros market forays over the decades, I’m more than confident that he is, once again, practicing one of his strategies of saying one thing while doing the exact opposite. Mr. Soros is an old hand at the markets and how to trade them effectively.
Good traders never tip their hand but do, quite often,let ‘slip’ the exact opposite information in order to further profit from their actual positions.
HOW TO KNOW THE TRUTH ABOUT THE STOCK MARKET
This site and my work revolves around understanding markets and their true ‘intentions’ through the use of price charts of various kinds.
That, plus over four-decades of experience interpreting, trading and researching the markets, goes a long, long ways toward understanding what’s really going on versus what others ‘say’ is going on.Once again, news about the markets is given on too short a time frame to gain the proper perspective of where one is within the trend.The chart below shows the usual short-term chart most see for the Stock Market:
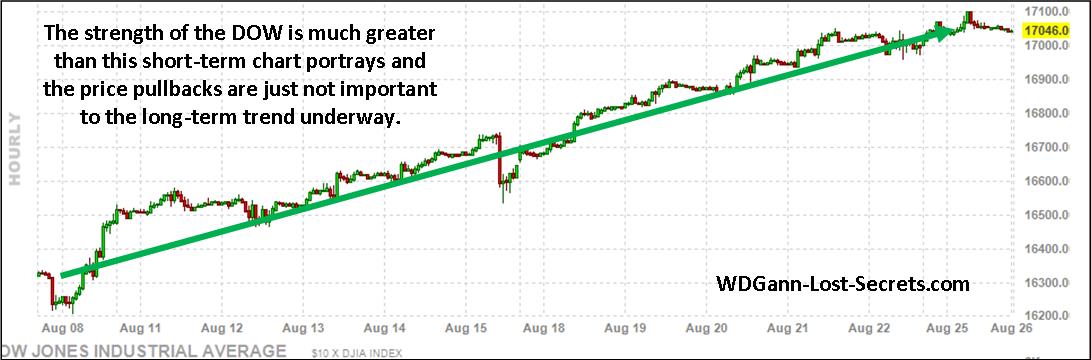 By looking at the daily prices, it becomes too easy to become ‘spooked’ by price pullbacks that are actually irrelevant to the continuing trend in progress.
Each drop in price shown on this chart came with panic news reports suggesting that the entire stock market uptrend was coming to an end.
It didn’t.
And, as you’ll see by looking at the next chart, it won’t unless prices drop below the green uptrend line shown on the chart.
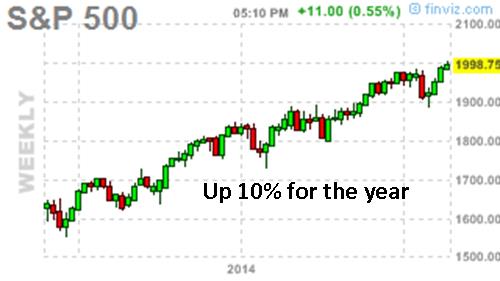
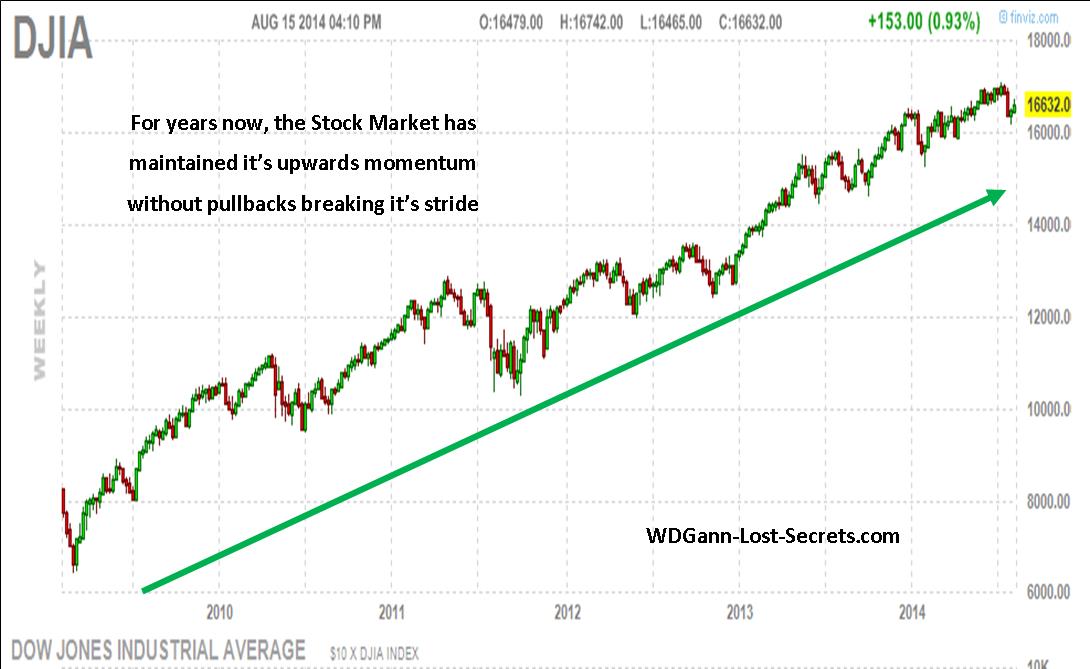 Instead of just a few days or weeks, we’re now looking at the price action of the DOW for YEARS.
Obviously, this shows that the uptrend that’s in play is strong and won’t be upset by a few days of downward price movement.
Prices are only at the middle of their range at present, so, they can easily go much higher.
The insiders know this.
George Soros knows this.
Don’t let them instill a fear of investing within you.
PERSPECTIVE APPLIED TO THE STOCK MARKET IS THE ANTIDOTE TO EMOTIONAL NEWS OR REACTIONS. – George
Apply the proper tools to analyzing these markets (like those used on this site) in order to build confidence and withstand the fear mongers..
This website’s intention has always been educational and the design of the methods used to analyze the markets has always protective of the trader and investor. To do that I’ve had to discover and re-discover (in Mr. Gann’s case) the fundamental laws of the markets and their structure. By doing so and analyzing markets with these tools, a more stable and reliable result can be found. One that inspires growing confidence with use.
The results speak for themselves as the archives will show and my mission has been to teach the principles and methods that will allow you to do the same for your own interests and investments.
If you want to know more, take the time to click the banner below and send me an e-mail requesting price and regional availability. Thanks. – George

![]()