George Harrison
Author Archives: George Harrison

The S&P 500: Entry & Exit Points . . .

The ​Intraday Stock Market as represented by the S&P 500 Index, is, as mentioned in our earlier post, one of the favorite markets for day-traders due to it's activity and large volume. 

​Applying the 'Fibonacci Trends' Trading Technique to the S&P 500 Index on an intraday basis reveals two entry points for new trades, two-Stop points and the current Exit to the last Short trade put on Friday. To view it better you can simply roll your mouse over and, CLICK ON CHART TO ENLARGE

View the Testimonial below showing the first trade taken using this extraordinary method of market analysis. from a recent purchaser and intraday trader of The Fibonacci Trends Trading Method. This is an unsolicited testimony shared with their permission. - George

GBP/USD Trade Opportunities: The Last 3 Days . . .

The Forex Markets are always ready to provide opportunities to those with the 'eyes to see' what's really going on at the fundamental cores of Price and Time. As shown below, the last 3-Days alone gave three great trade set-ups for those using our latest Course discovery, 'Fibonacci Trends'. On the chart below,

​we look at the GBP/USD Forex pair and find two excellent trades (with one still going at this writing) that were signaled well-in-advance. View the Testimonial below showing the first trade taken with this extraordinary method of market analysis. from a recent purchaser and trader of The Fibonacci Trends Trading Method: 

View the Testimonial below showing the first trade taken with this extraordinary method of market analysis. from a recent purchaser and trader of The Fibonacci Trends Trading Method:


WD Gann: For Speculators & Investors . . .

. . . FOR SPECULATORS & INVESTORS

GannImages&Quote

W.D. Gann urged all students of the Markets to study and learn from past experience and History.

I’d add that there are Universal Concepts that always have applied and still apply to the Markets.

These concepts are largely invisible to traders and investors and, one must learn them in one of two ways: through long years of experience through loss and failure or, alternatively, by learning from others who have discovered these Market Truths independently.

Nature will respect either Path to Truth.

If one chooses the second way, they can obtain the information and wisdom of decades in a short time.

This way one may substitute a tuition fee for the long years of personal study, test and failure.

Money thus substitutes for Time in this choice, but, one still must possess the self-control and discipline to apply what is learned.

If you’d prefer to choose this Second Path to Market Truths, then, I’d like to encourage you to take a closer look at The Harrison-Gann Trade Secrets Master Course or the other Separate and Unique Courses and sets of technical trading method discoveries available on this website exclusively.

They will save you decades of work and tens of thousands in losses from ‘learning-by-mistake’.

Write me HERE for availability and cost. – George

WD Gann Review: Hope and Fear in the Markets . . .

                                                  It’s Time for Us to Review:

                                                     W.D. Gann’s Timeless Rules for Trading

Young WD Gann

HOPE AND FEAR

By W. D. Gann

“I repeat this because I have seen so many people go broke trading on hope or fear. You will never succeed buying or selling when you hope the market is going up or down.

You will never succeed by making a trade because you fear the market is going up or down. Hope will ruin you, because it is nothing more than wishful thinking and provides no basis for action.

Fear will often save you if you act quickly when you see that you are wrong.

“The fear of the market is the beginning of wisdom”

Knowledge which you can only obtain by deep study will help you to make a success. The more you study past records the surer you are to be able to detect the trend of the future.”

George’s Commentary: Nobody wants to admit to having fear, yet, beneath most trader’s activities lies a fear of loss or of missing a profit opportunity. We’ve also been encouraged or programmed to rely on Hope as if it were ‘real’. It isn’t.

It’s a speculation built on probabilities at best and, on nothing but other’s (or our own) opinions at worst. Mr. Gann addresses that here. Discipline against Hope and Fear is one of the most effective and fundamental steps we can take to become better traders. – GR Harrison

S&P 500 Stock Index (SPY) Hourly Trends . . .

In response to an inquiry from a reader about how the 'Fibonacci Trends' Technique works in the Stock Market, I've created a hypothetical chart for the S&P 500 as represented by the SPY  ETF/Stock in the chart below.

​SPY is consistently one of the highest volume trading vehicles on U.S. exchanges. Average volume is typically over 80 million shares, although that does fluctuate over time. For many day traders, it's the only ETF/stock they trade. Many investors and hedge funds use SPY because it represents the S&P 500 index—a basket of 500 major U.S. companies.

Performance figures contained herein are hypothetical, unaudited and prepared by WDGann-Lost-Secrets.com; hypothetical results are intended for illustrative purposes only. Past performance is not indicative of future results, which may vary. There is a risk of substantial loss associated with trading stocks, commodities, futures, options and other financial instruments. Full disclosures here. Full Disclosure.

​For this chart, I used a shorter one-hour bar level of analysis in order to capture significant price movements in a shorter time-frame than the Daily price bar level. The moves shown have lasted for days in length and were not intra-day trading opportunities. Those would be many more in number and, of course, of shorter duration. - GR Harrison

History Repeats for Those With Eyes to See . . .

Here again, I’m re-posting an earlier Lesson from several years back as a reminder to us all of the Cyclical Nature of Time & Events.

Learn to Embrace the Historic Trend We’re in . . .

Among WD Gann’s most important work was his insistence that historic price patterns repeat in varying intervals.

Gann detailed out that 20-year, 30-year and 60-year cycles were very important for market trends.

200 Year Commodity War Cycle ChartHowever, there’s other cycles that can open the door to understanding our present times and economy as well.

We think that things are chaotic out there in the Economy and the World today, but, that’s just because we aren’t applying a distant enough perspective and enough historic evidence to the problem.

[2018 NOTE: The Chart to the left was indeed correct as we made another Commodity Cycle High in 2012.]

Mr. Gann made these comments about Economics and Politicians in his time:

“…CYCLES in business and the Stock and Commodity Markets have always repeated and always will.

Nature’s laws are unchangeable and no man or set of men can change them.

The New Dealers have not proved that they can stop inflation. They claim they can prevent DEPRESSION and PANICS, but no one has succeeded in doing it in the past and the next few years will prove that our Government leaders cannot stop a DEPRESSION by WASTE and SPENDING. . . .

Gann’s comments continue . . .

“The New Dealers have sown to the wind and must reap the whirlwind. During the past 20 years they have spent and wasted all the wealth that our country has accumulated during the past 175 years.

Our Federal, State and private debts are the largest in history, and these conditions make the next few years the most critical in our history.

The man who knows TIME CYCLES can predict the future, protect his capital and make money, while those who guess will lose.

This is the time of opportunity to start to study mathematical, scientific rules for making accurate deductions to determine the trend of Stocks, Business, and Commodities.”WD GANN from ‘Why Money Is Lost On Commodities and Stocks And How To Make Profits’, page 13.

Sounds like today’s headlines doesn’t it?

There’s truth in the Biblical saying that:

“The thing that hath been, it is that which shall be; and that which is done is that which shall be done, and there is no new thing under the sun.” – Eccl. 1:9.

There’s a comfort in knowing this once you’ve verified it’s accuracy because no one likes the unknown.

Plus, it’s good to know that times like these have been here before and passed on into history as will these.

Also, note that great fortunes are made in turbulent times because those who can’t read the cycles of History or who don’t understand market principles will be confused while those who do know these things will be able to prosper from that very confusion and act decisively while most can’t out of fear of the unknown future.

The Present seems mysterious, but, can become a familiar pattern once we lock in on the original history theme that’s repeating during our times. – George

Review: The Seasons of the Markets

I’m Reviving This Article from the Archives as we need to

Stay Conscious of this Principle.

NOTE: Though this was written over 4-years ago, the Principles it was based on are still holding and the Seasons mentioned are still in effect. – George

The ‘Seasons’ of the Markets

seedtimeandharvest

The Markets, as with Nature, also have Seasons of Spring, Summer, Fall and Winter

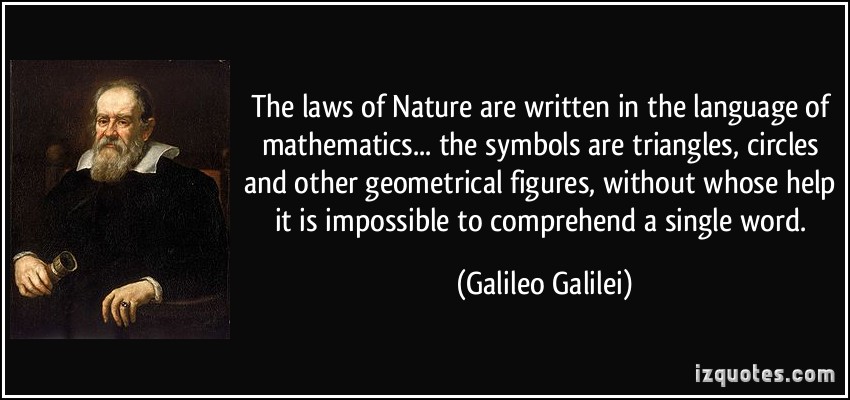
Nature’s Analogies: A Master Tool for Market Positioning

By GR Harrison – www.wdgann-lost-secrets.com

An Analogy is something ‘like’ something else in it’s behavior or nature and, was the basis of WD Gann’s work as it was a most useful way of understanding the World and the actions of things within it.

WD Gann worked from the Principles of Natural Law and, this system of thought took basic Principles and showed how they reflect throughout every level of existence at both the macrocosm and the microcosm levels.

The Ancients observed it and understood it’s applications. As Natural Law was purposely removed from the educational system of today, we’ve lost connection with this valuable knowledge and it’s uses with all things of this World. And, this includes the Markets. The Sages of old summed this Great Law into this short phrase . . .

“As Above, so Below”.

Man, despite his ‘intellect’, is not immune from working within the matrix and laws of Nature and those experiences which we all share can teach us great insights even into something so mundane as the markets and their price movements.

WD Gann depended on the reliability of it and, it never let him down. He wrote that one should always note where a market was in it’s ‘cycle’. Much like knowing whether one was in Summer or Winter would affect how we dressed and conducted our affairs. We know this instinctively now because we’ve come to learn (through experience) that each season of the year has it’s own characteristics and qualities.

The same would hold for Markets and their price behavior.

For instance, when the analogy of the Seasons are applied to markets, we can discover WHERE we are within the ‘Seasons’ of a Market.

When we know WHAT SEASON we’re in within a market’s cycle, we’ll know immediately what the next season coming will be and may take precautions and use our technical tools to watch for early indications that our present season has ended and the new one has begun.

For example, in the GOLD market many have ignored the seasons of the Gold market and substituted hope instead of reason (due in large measure to the constant promotion to buy gold by media and internet sources).

However, Summer doesn’t last forever and we must individually awake to the reality of the Season we’re in.

GannCycles

Price charts courtesy of Finviz.com. Indicators by WDGann-Lost-Secrets.com
CLICK CHART TO ENLARGE FOR VIEWING

Much as with those who still speak of global warming while heading towards the coldest winter conditions over the next decades, Passion has overruled the cold facts (sorry).

There’s no difference in the argument, and, in both cases, there were plenty of early clues to the shift in trend (weakest sunspot cycle in 190-years and declining (instead of climbing) global temperatures: see chart).

And, just as there was a warning of the turn in trend for Gold after it hit it’s Highs in 2011 and then broke it’s upwards momentum to a sideways trend.

global cooling - global surface temperature

Global temperatures are trending downwards not upwards according to this government satellite data. The long-term ‘Season’ of warming has ended and the long-term ‘Winter’ has begun.

No one knows why these trends change, but, then, one doesn’t really have to know.

Just following the trend and the ‘Seasons’ of the markets or the Global Climate (while keeping an open mind), will, at least, keep us on the correct side of reality versus the fiction of the moment in mainstream ‘news’.

In both cases, there are Grand Seasonal Cycles at work which have changed (while those following them have not noticed because they’ve been trapped by their own egos into holding a single, unwavering opinion no longer based in fact.

Realities are not issues of ‘political correctness’ or subject to social acceptance and the Laws of Nature can’t be voted into or out of existence.

We may not like the Reality. But, that doesn’t change it or it’s effects upon us if we ignore it or, worse, try to fight it.

SP500 'Seasons'

The cycle of ‘Seasons’ for the S&P 500 Index. If ‘Summer’ is here now, it’s certain that ‘Fall’ will surely follow . .
                            CLICK ON CHART TO ENLARGE FOR CLARITY

I’ve included another ‘Seasonal’ chart for your consideration. This one is for the S&P 500 Stock Index. There are several complete ‘Seasonal’ cycles that have taken place over the course of the time period covered on this chart (back to the 1970’s). The market’s most recent actions have taken us from ‘Spring’ back in 2009 and on into ‘Summer’ which we’re still enjoying.

Of course, no one basks in the sunshine of Summer forever.

The turning of the Seasons WILL come. There’s nothing to fear in that. Just preparations to take and signs to anticipate to know when the change has come. Most fear the markets at these levels and that fear creates hesitation leading to lost opportunities. However, if we can learn to work with the natural seasons of the markets, we’ll find our path far easier and the favorable trend will sweep us along with it like a kite in a gentle breeze.

As much as we’re able, we need to set aside the distractions of ‘outside’ influences and opinions and make our own sovereign judgments and take actions based on broad knowledge and critical understanding. All responsibility is ultimately our own as are the rewards. This is the epitome of mature and responsible investing and a balanced Life. – George

AGoldBarsBar

This Year’s FALL Special is About to Begin:

——————————————————————————————————————————–

LogoPNG-GannGroup-400

It’s never too late to Learn, and, that includes learning about just what makes these markets tick.

Real comfort can be derived from knowing that the same Principles used so successfully by W.D. Gann over a hundred years ago still work in the markets today. They, (the Principles), always will as long as 2+2=4 and other mathematical relationships remain in effect.

galileo-galilei-343034Wouldn’t you rather be operating by these unchanging Rules when you’re trading the Markets?

Consistent Principles applied rationally will yield Consistent Results.

They must!

This is the point and the goal most profess to be searching for.

Do you really understand the Principles behind:

TREND, STOPS, PRICE OBJECTIVES for SELLING & BUYING?

If not, take the time to Learn the Principles which have always driven the markets and always will.

We’ve developed teaching tools that can help those dedicated to this Quest for Wisdom. Over 45 years of research and practical testing have proven what is good, useful and lasting.

READ MORE ABOUT THESE COURSES ON THIS SITE AND THEN . . . CONTACT ME HERE BY E-MAIL FOR PRICE AND AVAILABILITY.

——————————————————————————————————————————–

Intraday Forex Opportunities . . .

​T​hese kinds of opportunities reveal themselves every day, BUT, only if you've the Tools to see them .

Performance figures contained herein are hypothetical, unaudited and prepared by WDGann-Lost-Secrets.com; hypothetical results are intended for illustrative purposes only. Past performance is not indicative of future results, which may vary. There is a risk of substantial loss associated with trading stocks, commodities, futures, options and other financial instruments. Full disclosures here.

​USD/CAD: Here's just 2 of several potential Intraday Trading Opportunities.

Those taking our Courses are exposed to multiple trading techniques that provide great entry & exit points (like the two shown on the chart above) for Markets at ​every time frame. ​

The Knowledge required to gain an 'Instinct' for these market turns is obtained by Knowledge, Study & Practice. We provide the Knowledge and the Study Opportunities. This Information is Rare, You're invited to join our very tight group of Students and Clients. - George

​Take a look at our 'Master Trading Collection' MENU TAB at the top of this website, find the course or courses of interest that seem to match your trading style, then, e-mail me (by clicking here) for a personalized quote. - George

​--------------------------------------------------------------------------------------------------------------------------------------------------------


Intra-day Gold Trades Update . . .

​Today, we look at the ​signal set-up from Friday's trading of GOLD . . .

Performance figures contained herein are hypothetical, unaudited and prepared by WDGann-Lost-Secrets.com; hypothetical results are intended for illustrative purposes only. Past performance is not indicative of future results, which may vary. There is a risk of substantial loss associated with trading stocks, commodities, futures, options and other financial instruments. Full disclosures here.

​Gold: Intraday Trading Signals Using the 'Fibonacci Trends' approach.

​Our Hypothetical Trades for GOLD during the last week's trading using the 'Fibonacci Trends' Trading Method would have yielded (hypothetically), at least $2,500 USD in Closed Trade Profits and, $600 USD in open trades still running. The present Stop is shown on the right-side of the price chart. - George

​--------------------------------------------------------------------------------------------------------------------------------------------------------


S&P 500 Intra-day + Crude Oil/Gold Update . . .

​Today, we look at the intra-day set-up for Friday's trading for the S&P 500 Stock Index (SPY, etc.) . . .

Performance figures contained herein are hypothetical, unaudited and prepared by WDGann-Lost-Secrets.com; hypothetical results are intended for illustrative purposes only. Past performance is not indicative of future results, which may vary. There is a risk of substantial loss associated with trading stocks, commodities, futures, options and other financial instruments. Full disclosures here.

​S&P 500 Stock Index: Intraday Trading Signals Using the 'Fibonacci Trends' approach.

​The S&P 500 had a pull-back during Thursday's trading. ​Prices brought us to a reversal in trend signal to exit our previous hypothetical SHORT trade for a profit potential of $3,750 USD for a 1-day trade. We also entered LONG on the same signal as this is the preferred and Major Trend for this market.

What comes next for CRUDE OIL? We are LONG the S&P on on Thursday's signal and have a reversal price at 2895.​ It will take a closing price below $2895, (with most of it's hourly range below this price), to persuade that the present short-term uptrend was over. Until then, stay with the trend for higher prices in the ​S&P 500 Stock Index.

Performance figures contained herein are hypothetical, unaudited and prepared by WDGann-Lost-Secrets.com; hypothetical results are intended for illustrative purposes only. Past performance is not indicative of future results, which may vary. There is a risk of substantial loss associated with trading stocks, commodities, futures, options and other financial instruments. Full disclosures here.

CRUDE OIL Intraday Trading Signals Using the 'Fibonacci Trends' approach.

​CRUDE OIL continued it's trend from yesterday's trading. We came close to the reversal price, but, did not penetrate it, further confirming the upside price potential for Crude Oil.

What comes next for CRUDE? We advanced our Stop by $250 and, remember that the same technique that brought us here is still in play potentially yielding over $1,900 USD in profits since the original BUY signal yesterday. It would take a closing price below $69.75, (with most of it's hourly range below this price), to persuade that the present short-term uptrend was over. Until then, stay with the trend for higher prices in CRUDE OIL.

​--------------------------------------------------------------------------------------------------------------------------------------------------------

And, now ​let's look at our GOLD signals on the very short-term (intra-day-to-next day) trends.

The 'Fibonacci Trends' Method gave us a Short entry signal entry signal around 11 P.M. last evening. This trend has continued through today up until the time of this posting. There is another potential Short signal present at the $1205 price level. As mentioned earlier, the previous Short trade gave a hypothetical $1,000 profit potential. At present, the hypothetical profit potential for this latest trade is at $500 and counting.

Performance figures contained herein are hypothetical, unaudited and prepared by WDGann-Lost-Secrets.com; hypothetical results are intended for illustrative purposes only. Past performance is not indicative of future results, which may vary. There is a risk of substantial loss associated with trading stocks, commodities, futures, options and other financial instruments. Full disclosures here.

​GOLD Intra-day Trading Signals Using the 'Fibonacci Trends' approach.

​What comes next for GOLD? ​The SHORT entry side is holding until the time of this posting. Further confirmation will come if prices drop below $1205 USD. A reversal point to the upside is hovering close by at around $1208. Remember: The Major Trend is DOWN, ​​​​​so, lower prices shouldn't alarm you, but, should be expected as part of the price process. Be ready. - George


Crude Oil Short-term & Gold Follow-up . . .

​A sharp upswing in CRUDE OIL took place in the early NY morning session. The 'Fibonacci Trends' Trading Technique created a BUY Signal early in the turn as shown on the chart below . . .

Performance figures contained herein are hypothetical, unaudited and prepared by WDGann-Lost-Secrets.com; hypothetical results are intended for illustrative purposes only. Past performance is not indicative of future results, which may vary. There is a risk of substantial loss associated with trading stocks, commodities, futures, options and other financial instruments. Full disclosures here.

CRUDE OIL Intraday Trading Signals Using the 'Fibonacci Trends' approach.

​This Trend was still underway at the Close of the NY Session.

What comes next for CRUDE OIL? Well, the same technique that brought us here is still in play. It would take a closing price below $69.50, (with most of it's hourly range below this price), to persuade that the present      short-term uptrend was over. Until then, I'm looking for higher prices in CRUDE OIL.

​--------------------------------------------------------------------------------------------------------------------------------------------------------

And, now to follow-up on our GOLD signals on the very short-term (intra-day-to-next day) trends.

The 'Fibonacci Trends' Method gave both an exit and Long entry signal around 7 P.M. last evening. This trend has continued through today up until the time of this posting. As mentioned earlier, the previous Short trade gave a hypothetical $1,000 profit potential. At present, the potential is at $300 and counting.

Performance figures contained herein are hypothetical, unaudited and prepared by WDGann-Lost-Secrets.com; hypothetical results are intended for illustrative purposes only. Past performance is not indicative of future results, which may vary. There is a risk of substantial loss associated with trading stocks, commodities, futures, options and other financial instruments. Full disclosures here.

​GOLD Intra-day Trading Signals Using the 'Fibonacci Trends' approach.

​What comes next for GOLD? ​The Long entry side is still holding up until the time of this posting, but, a reversal point is hovering close by at around $1211. Remember: The Major Trend is DOWN, ​​​​​so, lower prices shouldn't alarm you, but, should be expected as part of the price process. Be ready. - George


1 31 32 33 34 35 58