Tag Archives for " stock market trends "

Regardless of Opinion: Never Fight The Trend . . .

From: George R. Harrison; St. Croix, US Virgin Islands, July 20, 2017

There May Be Sound 'Reasons' For A Stock Decline, But . . .

  If The Market Chooses To Continue UP . . . We'll Follow It!

The Market is a Great Academy which is willing to teach us it's Secrets IF we're willing to learn and submit to it's Reality instead of our own 'opinions' or preconceived ideas of what will happen.

The Stock Market has recently visited us with another chance to learn this Lesson.

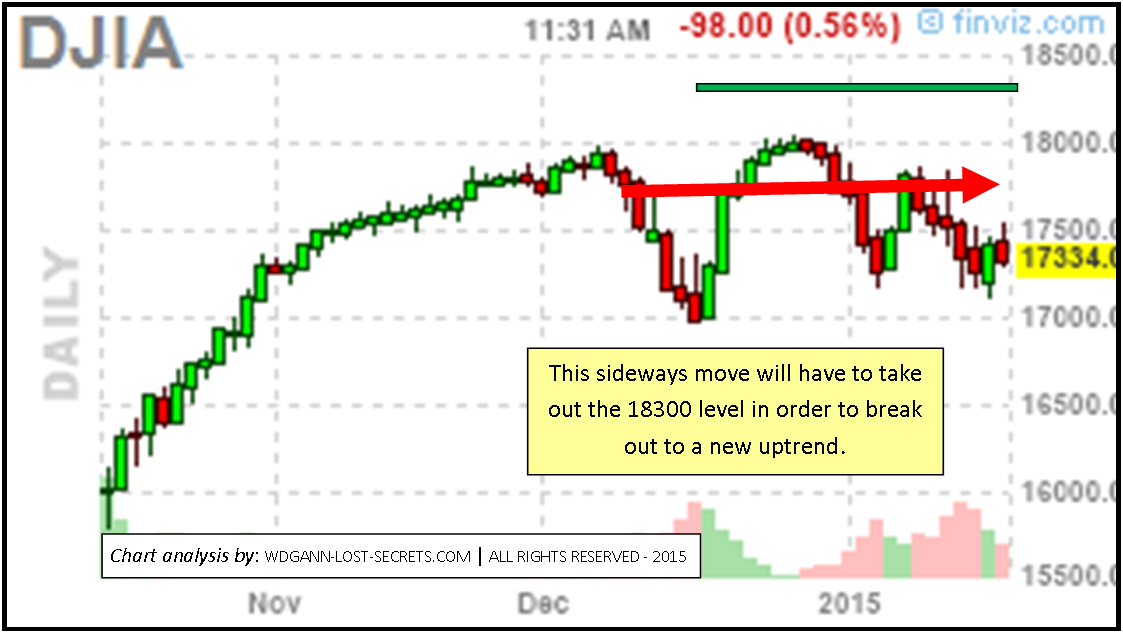
I've noted lately that there are ample 'Signs' and Cycles indicating that the Market is top-heavy and that a top could be indicated once a certain price level is penetrated to the downside. More and more of these factors are coming into focus that indicate that we should be wary, especially at certain price points like what happened about 3-weeks ago.

PRICES, however, ARE REALITY, and, they just didn't continue below our warning levels.

Instead, prices regained strength and then broke above the previous High price and closed in a higher region entirely.

The Market Reality is STRENGTH, not weakness and, no amount of opinion or other factors can outweigh the reality of Price. WD Gann acknowledged this same Reality of Price and, we'd be wise to follow his lead and do the same.

We must bow to the Markets and what they're saying and no one else. It's our job to follow the Market's Trend and not dispute it or even wait for it to prove ourselves 'right'. We're to be surfers on the price waves and to do that well, we have to get in tune with the trend and ride it for all it's worth.

We don't abandon all reason, however. Instead, we continue to use our excellent price following techniques & methods in order to detect the next critical turn and to protect ourselves accordingly.

Eventually, we'll catch the 'BIG ONE'; the Major Move (there's always another 'Big One' coming regardless of the trend) and take the profit ride of our Lives. Until then, though, there'll be many, many profitable sub-moves that we can take full advantage of.

It just makes sense to prepare yourself for this eventuality by learning one of our powerful market trading methods so that you'll be able to respond and position yourself early when these market turns arrive.

Request our Catalog of Proprietary Trading Techniques & Methods and take advantage of the 'Summer School' Special Offers which will be offered only a little while longer. Write: george@wdgann-lost-secrets.com

Write: george@wdgann-lost-secrets.com


- - - - - - - - - - - - - - - - - - - - - - - - - - - - - - - - - - - - - - - - - - - - - - - - - - - - - - - - - - - - - - - - - - - - - - -

Stock Market Angles of Support . . .

      Present Angle of Support for the S&P 500 is Unsustainable

      Watch This Market Closely

Note How Each Market Rally Since 1982 Has Been At Increasing Angles of Support

By George R. Harrison

The Chart you're looking at now is basically one-of-a-kind.

What most investors and traders aren't aware of is how much market trends depend on the energy contained within an angle of support and how important those angles are to determining how strong or weak a trend has become.

To better confirm just where the US S&P 500 Stock Index is in it's present trend, I've taken all the big trends since 1982 and shown their relative angles on this single chart.

What appears when we do this is a chronicle of rally-after-rally gaining strength and momentum over the one preceding and, therefore, having prices rise faster and faster.

This is, however, an unsustainable process eventually as we come up against the laws of Geometry and Physics as we approach a 90-degree vertical support line.

If you'll take a moment to view the support angles shown on the graphic above, you'll see the rising angles. The red-lined angle is our present S&P 500 Market move. It's extremely fast and steep.

Declines, when they inevitably come, also tend to be steeper and faster as well. Meaning that the fall from this high angle of support could be dizzying and faster than those preceding it in all likelihood.

The Bottom Line is this: The Stock Market Boom at present may continue further, but, will very likely reverse severely when it does break because of it's very steep angle of support. It takes a lot of buying power to sustain an angle of support this steep and, usually, the buying becomes exhausted suddenly. Present weakness in this market has been noted in my earlier post on April 19th, so, keep that as well as this new information in mind while closely watching price developments. - George

REMEMBER: This is just the balancing side of the yin-yang movement of markets and a natural occurrence. Nothing to fear here, just caution to exercise. Those who know that and have no fear of this normal process can also profit from it. Handsomely.

So, look at the markets in an opportunistic way and be ready for the trend shifts that naturally occur. Be ready to profit from both sides of trading; The Long side AND the Short side. - George


Those of you who are sincerely interested in taking in some of the courses offered should e-mail HERE.

The S&P 500 Uptrend Weakens . . .

      US Stock Market Momentum is Faltering

      Is This A Pause, Or a Turn In Trend?

This Market Is Starting To Look Like Other International Sell-offs in Stocks

By George R. Harrison

We now turn our gaze towards the US Stock Market as represented by the S&P 500 Index.

What we find is a reflection of what has already happened in some of the international stock markets; a slowdown in price trend momentum is taking place in the US Stock Market just as it has in the British Stock Market which we noted in our earlier post this week.

What's been noted using our techniques is that there is less strength on the upswings and weaker support on the pull-backs in price according to analysis using The Excalibur Method.

'Excalibur' indicates that we need to be aware of any closes below 2300 in the S&P 500 as indicating a very high probability of lower prices and a shift in price trend lasting months.

The chart displayed shows the price point to watch (the red horizontal price line at 2300).

This is yet another example of what can be done once one has learned just one of the unique tools offered on this website ('The Excalibur Trading Method'), If you're interested in acquiring a licensed copy of 'Excalibur' or one of my other courses for your own use, send me an e-mail - George

Those of you who are sincerely interested in taking in some of the courses offered should e-mail me HERE. - George

The Market Pauses . . .

Some Price Points for Breakaway Moves . . .

The Stock Market has expended a lot of energy in it's upwards climb since the election.

To assimilate this upwards price action, markets need to pause to re-energize and consolidate the recent price moves.

The trend has shifted to sideways which is essentially nothing more than a non-trending market state.

Whether the market breadth is for 30 stocks (the Dow), 500 stocks (the S&P 500 index) or the larger 2000 company group represented by the Russell 2000, we see the same action displayed: A consolidation or sideways trend is in process following our recent strong upswing in prices.

This, however, is not just a local market phenomena. By examining the Japanese Stock Index, we find the very same type of activity: a pause in upward momentum.

I've provided a few price points to watch in the Nikkei and the Dow in the charts to the left.

It would not be out of line at all for the markets to pull back like a spring and then launch upwards to new highs.

One needs to allow a certain amount of price movement (which is derived from some formulas I've learned over the last 45+ years of studying WD Gann's materials, clues & rediscoveries) in order not to panic when prices pull down from their present high points.

Locating critical price levels for highs and lows as well as highly probably turn dates are really some of the most sought-out tools that traders wish for.

Predictions can be made very accurately, but, one must first put away faulty assumptions and teachings. - George

Interest Rates Are Now Poised To Go Higher

Now Is The Time To Watch The Bond Market Very Closely! 

Click on above Chart to Enlarge for Clarity

Our Evaluation Shows That We Are Now At A Bond Crossroads Price

Undetected by most, Interest Rates have crawled their way upwards to a point where they can become airborne again with just a slight further drop in prices in the US Bonds. This is something not experienced by the present generation of traders and, so, not on their radar.

History and superior analysis techniques are what's needed to evaluate something which a new generation of traders haven't experienced in their lifetimes. We must study the Past to learn what is possible and what must come in the future.

WD Gann was adamant about the need to study historical charts. His great Success as a trader was predicated and built upon this one Principle.

If you're serious about trading or investing and, you'd like to see where our private techniques would give BUY or SELL signals for the Interest Rate Markets; what kind of potential profit was offered & receive notice of future Market turn opportunities, just fill out the form below and sign up for our WD Gann Trader's Group . . .

Thank You for Signing Up!

The Stock Market Has Been ‘Reset’ To Go Higher

The S&P 500 Reacted Exactly Within It's Natural Limits! 

Click on above Chart to Enlarge for Clarity

Our Evaluation Has Shown That The Election Day 'Pull-back Was Normal And Within Expectations For This Market & This Year.

Many experienced Election Day jitters this last week, but, in reality,the so-called big pull-back in prices was only the latest of 3 pull-backs that have happened this year alone! In fact, prices acted completely NORMALLY (although quickly) as shown on the chart above. Note all these 3 pull-backs in price were essentially equal.

If you're serious about trading or investing and, you'd like to see where our private techniques would give BUY or SELL signals for the S&P 500 Market; what kind of potential profit was offered & receive notice of future Market turn opportunities, just fill out the form below and sign up for our WD Gann Trader's Group . . .

Thank You for Signing Up!

Stock Market Uptrend Continues

STOCKS SURGE UPWARDS AGAIN

The upwards trend for the Stock Market as represented by the S&P 500 is continuing much to the surprise of most pundits.

Though I've posted several articles warning about this continuing trend upwards, most other commenters have been expecting a crash for years now.

The chart to the left shows we're only just coming out of a bottom BUYING price area while the market's underlying UPTREND continues. - George

NOTE: The previously hidden techniques to analyze these markets (and all others), are now available through our select courses. The Stairway & Excalibur Trading Methods and our Master Course elements will show you the way to accurately interpret market charts, trends, tops, bottoms, optimal entry & exit points as well as lower-risk stop placement points. Contact George for price & availability. email: george[at]wdgann-lost-secrets.com (substitute the symbol @ for the word [at] in the above address.

The Stock Market: Shifting Momentum

THE STOCK MARKET’S SHIFTING MOMENTUM

What we’ve been witnessing with the Stock Market these last months (beneath the hype and headlines) is the shifting of price momentum. I’ve outlined this process with the red arrows on the chart following . . .

djia

This has slowed this previously hyper-trending market’s advance to a non-trending, sideways entity.

Essentially, the market has become (depending on one’s perspective) either ‘boring’ or ‘precariously balanced on a cliff’. Perspective, however, is very point-of-view slanted and, is therefore, non-objective.

Perspective is emotion-laden (because of it’s point-of-view nature) and not to be trusted in the investment or speculative arena. It’s important to rely on objective means of evaluation and to use those tools consistently.

While the popular ‘points-of-view’ about this market are displayed everywhere on the net it seems, almost no one discusses the upside potential to this strong market.

Here’s how things look to the upside from this perspective (using opinion-independent tools) . .  .

djia2

The usual trap before breakouts to higher levels consists in taking out the previous highs (implying an immediate higher price breakout). However, this event alone will not be enough to indicate the renewal of the strong trend upwards.

Instead, don’t expect the trend to be seriously established until price goes through 18,300 on the DJIA on the upside.

This price area will keep one out of the price-choppy action which comes with sideways moves.

As for the downside break (which far too many are expecting – not a good sign), the same trick will likely be attempted in reverse. Lower lows taking out the previous lows implying (the ‘Trick’ again) that prices are going to break down seriously and immediately. They won’t, however, on this basis alone.

It will take even lower prices to lock that into place. Let’s take a look at the downside support . . .

djia3Keep in mind the slowing momentum of the Stock Market, which should still be viewed as only a pause in the trend until proven otherwise by prices penetrating the support area presented above.

Don’t be taken in by any quick price moves at either extremes (of high or low) and, instead, allow a little price ‘buffer’ space both above and below our present sideways price range. George