George Harrison
Author Archives: George Harrison

Forget Which Market; Find Profit Opportunities!

     Search For Profit Opportunity; Opportunity is Everything . . .

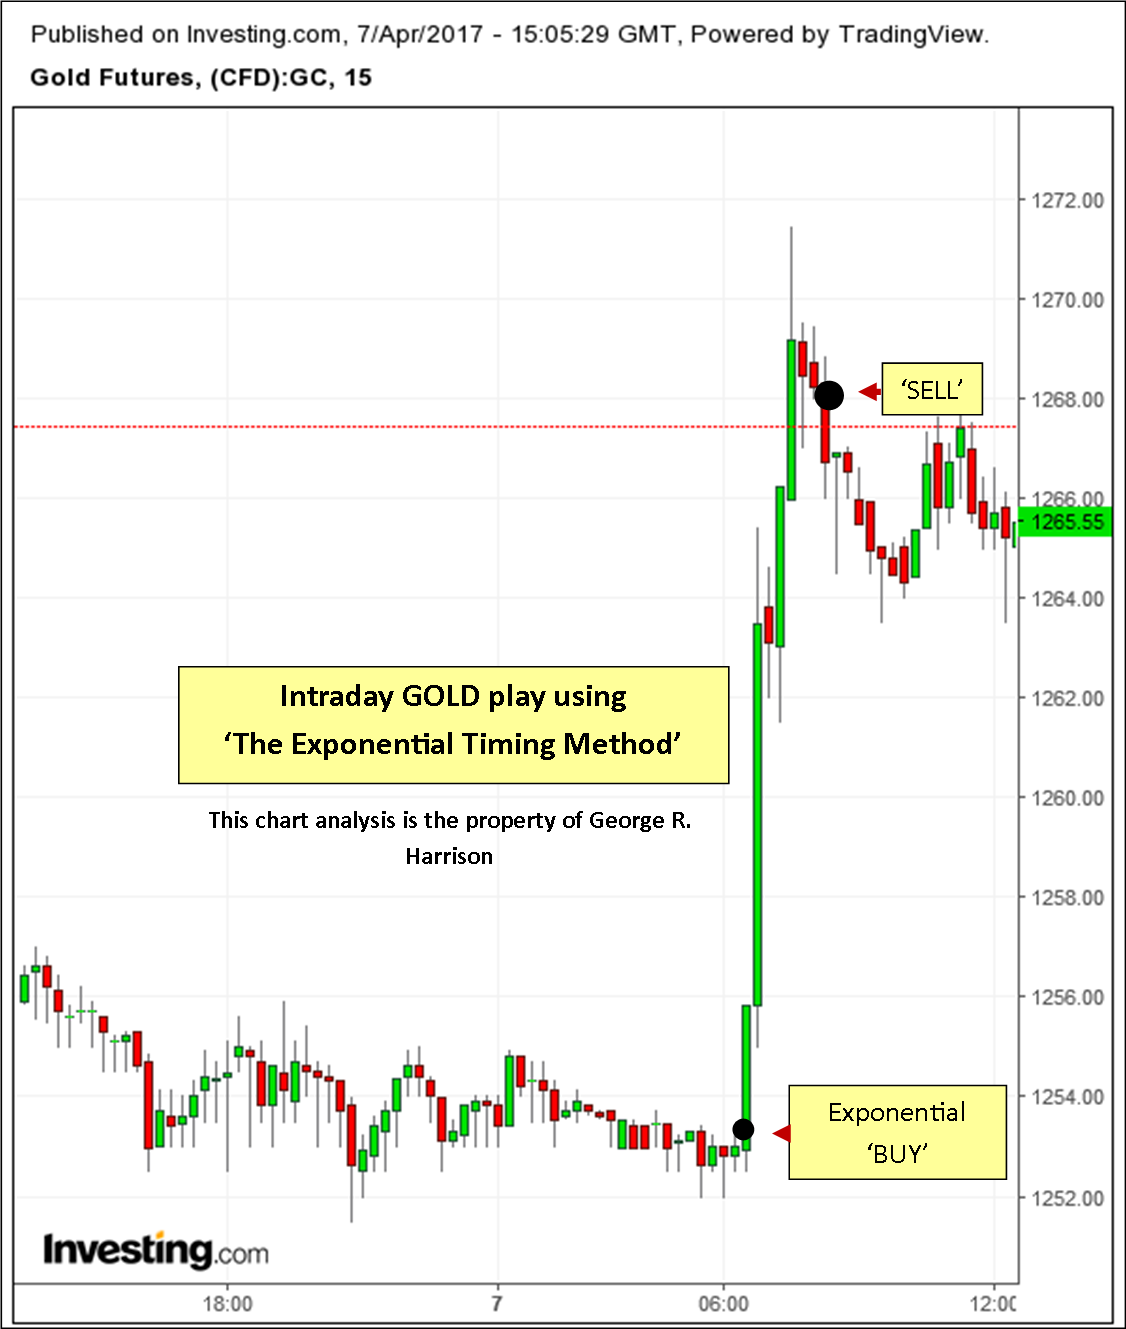
  Look At The Potential That Happened Over The Last Few Days

By George R. Harrison

I shouldn't be amazed any more, but, every time I post about an exotic or unusual market, someone unsubscribes from our mailing list. Like Bitcoin, the fastest growing market for 2017, certainly that qualifies for coverage if one is seeking profit opportunity, yes?

Evidently, there's a new crop of traders or investors who are misunderstanding the whole purpose of speculating: which is to make a profit!

To make a profit, we need to know where Profit is hanging it's hat at any particular time. That's where our study of the Markets come in.

This isn't an idea that I invented either. It's the Name of the Game. WD Gann speculated in everything and every market you could find in his day (including the Cuban Lottery!). Commodities, Stocks. It didn't matter to him. It shouldn't matter to you either if you wish to emulate the Master Trader, WD Gann himself.

That thing called 'Luck' favors those who are open to new opportunities, not the old ones that have already come and gone.

The 'Crowd' is still looking in the usual places for lost pennies on the ground while the Dollars have moved to new, more welcome places.

This is just how Life is, and, we're well into a new era where the quick & agile investor who's willing to try new things is going to later be called, admiringly, a Financial Pioneer and Genius!

So, for those who think new or unusual markets are uncomfortable, you need to re-examine just why you're in the trading or investing Game at all. Doing what everyone else is doing will only yield the same results that they're getting; meager at best and usually with miserable returns on capital risked.

It's not a choice really. Not if you wish to be one of the 'favored' and 'Lucky' few, the successful new investors who saw Opportunity while everyone else was still looking in their familiar & friendly back yards.

You see, it never is 'Luck', it's leaving oneself open to Opportunity, wherever it comes from.

Have a great new Week. - George

---------------------------------------------------------------------------------------------------------------------------------------------------------

Are you ready? Are you seriously interested in learning some of our unique trading techniques? Then take a few moments to E-mail me HERE. The new Catalog of our offerings is now available.

This Week’s S&P 500 High-Low Swings

Live Daily S&P 500 Futures Prices

Live Daily S&P 500 Futures Prices

     Expect a Pull-back from this present Top price area.

  You'll note that we're entering an anticipated High Price Zone

    'The Excalibur Method' can anticipate Tops AND Bottoms.

By George R. Harrison

“There is nothing in the Universe but mathematical points of force.” - Michael Faraday

The Laws of Probability and Trend need to be applied whenever markets or market conditions tend to evoke emotional, mood-driven responses instead of rational, pre-planned ones.

In the case of the Stock Market (as represented by the S&P 500 Stock Index), we've just experienced an excellent upswing in prices; a good 'run' in one direction: UP.

Longer, uninterrupted 'runs' are necessary to establish 'trends' in price direction (like the upwards direction we're presently enjoying in the S&P 500).

On the top chart, during shorter up swings, we managed to (or rather 'The Excalibur Method' technique managed to) predict the TOPS extremely accurately (or to be less modest, better than any other trading technique out there!)

This time we've had an extended and strong upswing lasting 7-Trading Days.

The number '7' has strong vibrational price turning properties and that, aligned with Excalibur's anticipated TOP price area (shown as the highest green horizontal rectangle on the chart) tends to confirm this week's being the time for either an explosive upswing surge to much higher levels or the more 'normal' top price being reached and an expected, follow-up, pull-back in prices.

Let's look at where prices could go if the price pull-back scenario is correct.

Let's look at the chart and note that there are two red horizontal rectangles present that are below present trading prices.

The highest of the two rectangles denotes how far prices could easily drop in the course of the next few day's trading.

The lowest of the two rectangles (just below 2360) would represent a major pull-back (within the present uptrend) in prices. If closing prices dropped below this price level, we'd be talking about a a breaking of the last two month's bull market move.

Should the lower-probability major surge in prices occur on Tuesday, prices could conceivably go as high as the 2489-90 area and, go there quickly before finding another TOP area to reflect back from.

WARNING: The analysis you're reading here is only projecting out for the next 3 to 5-Trading Days at most. Markets are Dynamic. Any method of analysis that doesn't adapt to changing market conditions is worthless.

All of our time-based trading techniques are DYNAMIC by design. These methods of analysis are as current as the last entry on the chart you're using. In short, use a technique that's RESPONSIVE TO THE MARKETS THAT YOU'RE TRADING!

Opportunity-spotting is just what methods like 'Stairway', 'Excalibur', 'Exponential'. 'Trader's Moon and our other courses are all about. They take the 'noise' of market price confusion and filter out the meaningless data and, better yet in my opinion, they teach you how to do this apart from a computer or the confines of specialized software which you don't understand.

With our Courses you will learn an extremely valuable and powerful SKILL that will last and serve you for a Lifetime.

Are you ready? Are you seriously interested in learning some of our unique trading techniques? Then take a few moments to E-mail me HERE. The new Catalog of our offerings is now available.

BitCoin Success with Combined Trading Methods

     Bitcoin's big upsurge in price predicted it's very downfall.

    The only safe way to play markets this volatile, . . .

    . . . Is to understand their limitations & grab profits quickly.

Exponential upswings in price will reveal their built-in limitations to those 'in the know'.

By George R. Harrison

Back on April 27th we showed how using one of our trading methods called 'The Stairway Trading Method' could have revealed an ideal early BUY price for what became a monstrous upswing in the market known as Bitcoin.

Once the upswing started to take off, an additional and very valuable course called 'The Exponential Trading Method' could have been called into play.

'Exponential' is built especially for volatile, fast-moving markets nearing their tops or bottoms. It's specialty is to catch these reversal points before almost any other method in existence.

It certainly accomplished that with the Bitcoin market by giving a signal to exit before this market pulled back over $500 in price.

The important lesson here for our clients and visitors is to observe how well two or more of our special trading methods can work together to accomplish the goal of maximum profits and minimum risk.

I'd add another comment as well.

A Market is a Market. Profit is the name of the Game and, as long as there's adequate volume to sustain entries and exits immediately and reasonable spreads on the bid & ask prices, there's no reason to ignore opportunities when they arise even if the market seems 'exotic' or unfamiliar.

Does the fact that I've focused on Bitcoin here mean that I think that this market will last forever and replace Gold? No, it doesn't.

But, when Opportunity presents itself by analyzing a market according to the above mentioned criteria and our special course methods, one should opt to take advantage of the opportunity however short-lived the time frame may be. Profit is profit. However, one must always use money management and loss control as the first priority.

Opportunity-spotting is just what methods like 'Stairway', 'Excalibur', 'Exponential'. 'Trader's Moon and our other courses are all about. They take the 'noise' of market price confusion and filter out the meaningless data and, better yet in my opinion, they teach you how to do this apart from a computer or the chains of specialized software which you don't understand.

With our Courses you will learn an extremely valuable and powerful SKILL that will last and serve you for a Lifetime.


Are you ready? Are you seriously interested in learning some of our unique trading techniques? Then take a few moments to E-mail me HERE. The new Catalog of our offerings is now available.

Important Notice to Clients & Students . . .

     Don't Follow Too Closely With Stops! Wait For a Lower Entry.

    The Euro is backing down a little, buy on pull-backs only, . . .

The steep angle of the gains means we can expect a good pull--back over the next few days.

By George R. Harrison

The latest surge in up-swinging EURO prices is likely to take brief pause for at least a few days and pull back down in price a bit

There's presently a strong price support at the 1.1050 level which should hold as long as the latest price trend momentum is in place.

Should prices break below 1.1050, then, price trend can be expected to go lower for a week or more.


Seriously interested in learning some of the unique trading techniques offered here?Then take a few moments to E-mail me HERE. The new Catalog of our offerings is now available.

Daily Price Trend Euro Support . . .

     Don't Follow Too Closely With Stops! Wait For a Lower Entry.

    The Euro is backing down a little, buy on pull-backs only, . . .

The steep angle of the gains means we can expect a good pull--back over the next few days.

By George R. Harrison

The latest surge in up-swinging EURO prices is likely to take brief pause for at least a few days and pull back down in price a bit

There's presently a strong price support at the 1.1050 level which should hold as long as the latest price trend momentum is in place.

Should prices break below 1.1050, then, price trend can be expected to go lower for a week or more.


Seriously interested in learning some of the unique trading techniques offered here?Then take a few moments to E-mail me HERE. The new Catalog of our offerings is now available.

Quality Provides It’s Own Rewards . . .


TAKE ACTION TO ADD QUALITY TO YOUR TRADING APPROACH


The Most Hidden Trading Secrets in the World Lie Within These Courses

By George R. Harrison

Our present rapidly changing financial times demand that those who do take seriously their responsibility to protect family portfolios and retirement funds have the greatest need for the protection which only these analytical techniques offer.

Our So, the question then becomes: "How do I achieve my goals in the most efficient way?" Do you want to 'paddle' your way through the financial surf or do you want to get there faster and 'in style'?

Is Your Trading/Investment Method a 'Rowboat' or a 'Yacht'?

A Yacht is not a rowboat and the significant pricing differences between them both makes their true values abundantly clear to all concerned.

If you're seeking a better way to get to your financial destination, then you should give up the 'rowboat' mentality when it comes to trading & investment methods. You need to travel with 'Class'. Quality is the Rule.

Take action now to learn more about the exclusive trading methods offered only here.

E-mail George HERE.

‘Stairway’ BitCoin Gains of 25% . . .

     Don't Play Market Favorites', Go Where The Gains Are!

    BitCoin has offered many opportunities for gains . . .

The most recent gains in just the last month were over 25% in Bitcoin.

By George R. Harrison

Human Beings are creatures of habit. Investors are no different.

However, the only habits that a successful trader should hang onto are those associated with correct money management, risk control and their successful, trading techniques.

When it comes to 'where' we make our gains or what market they're in, we should be as flexible as a leaf on a tree going along with whatever the direction of the prevailing wind dictates (going with the trend).

Yes, we may favor the forex, commodity or stock market out of familiarity, but, this shouldn't blind us to opportunities which present themselves elsewhere. No matter how new or unfamiliar they may be.

Bitcoin is one such market. Most have ignored it intentionally, because it's so new, but, those who were the boldest came into this market a few years back and many have built fortunes on this purposely overlooked market. Why shouldn't you be one?

What matters most is liquidity, price charts and good techniques like the Stairway, Excalibur or MBP Trading Methods which we carry on this website.

Bitcoin certainly has liquidity and great price charts available. As to the techniques described, these applied to the Bitcoin market have yielded incredible gains these last few years.

The Bottom Line is this: One needs to graduate and expand one's vision of what's possible out there. While waiting in a 'popular' market that's stagnant, there may be plenty of profit growth potential elsewhere; in another, less popular market. Some won't want to hear this, but, it's the Truth even so and, that's what's presented here; Truth.- George


Seriously interested in taking in some of the courses offered here? E-mail George HERE.

Stock Market Angles of Support . . .

      Present Angle of Support for the S&P 500 is Unsustainable

      Watch This Market Closely

Note How Each Market Rally Since 1982 Has Been At Increasing Angles of Support

By George R. Harrison

The Chart you're looking at now is basically one-of-a-kind.

What most investors and traders aren't aware of is how much market trends depend on the energy contained within an angle of support and how important those angles are to determining how strong or weak a trend has become.

To better confirm just where the US S&P 500 Stock Index is in it's present trend, I've taken all the big trends since 1982 and shown their relative angles on this single chart.

What appears when we do this is a chronicle of rally-after-rally gaining strength and momentum over the one preceding and, therefore, having prices rise faster and faster.

This is, however, an unsustainable process eventually as we come up against the laws of Geometry and Physics as we approach a 90-degree vertical support line.

If you'll take a moment to view the support angles shown on the graphic above, you'll see the rising angles. The red-lined angle is our present S&P 500 Market move. It's extremely fast and steep.

Declines, when they inevitably come, also tend to be steeper and faster as well. Meaning that the fall from this high angle of support could be dizzying and faster than those preceding it in all likelihood.

The Bottom Line is this: The Stock Market Boom at present may continue further, but, will very likely reverse severely when it does break because of it's very steep angle of support. It takes a lot of buying power to sustain an angle of support this steep and, usually, the buying becomes exhausted suddenly. Present weakness in this market has been noted in my earlier post on April 19th, so, keep that as well as this new information in mind while closely watching price developments. - George

REMEMBER: This is just the balancing side of the yin-yang movement of markets and a natural occurrence. Nothing to fear here, just caution to exercise. Those who know that and have no fear of this normal process can also profit from it. Handsomely.

So, look at the markets in an opportunistic way and be ready for the trend shifts that naturally occur. Be ready to profit from both sides of trading; The Long side AND the Short side. - George


Those of you who are sincerely interested in taking in some of the courses offered should e-mail HERE.

The S&P 500 Uptrend Weakens . . .

      US Stock Market Momentum is Faltering

      Is This A Pause, Or a Turn In Trend?

This Market Is Starting To Look Like Other International Sell-offs in Stocks

By George R. Harrison

We now turn our gaze towards the US Stock Market as represented by the S&P 500 Index.

What we find is a reflection of what has already happened in some of the international stock markets; a slowdown in price trend momentum is taking place in the US Stock Market just as it has in the British Stock Market which we noted in our earlier post this week.

What's been noted using our techniques is that there is less strength on the upswings and weaker support on the pull-backs in price according to analysis using The Excalibur Method.

'Excalibur' indicates that we need to be aware of any closes below 2300 in the S&P 500 as indicating a very high probability of lower prices and a shift in price trend lasting months.

The chart displayed shows the price point to watch (the red horizontal price line at 2300).

This is yet another example of what can be done once one has learned just one of the unique tools offered on this website ('The Excalibur Trading Method'), If you're interested in acquiring a licensed copy of 'Excalibur' or one of my other courses for your own use, send me an e-mail - George

Those of you who are sincerely interested in taking in some of the courses offered should e-mail me HERE. - George

The Slide Begins . . .

      The Weakest Markets Are First To The Exits

      The FTSE-100 Was Triggered First To Sell-off

This is one of the Earliest Markets to Indicate A Potential Global Sell-off in Stocks

By George R. Harrison

Turning our attention now to The British Stock Market we find that we've been given early warning of a weakening and collapse in prices. The Excalibur Method saw the first indicator of this almost a month ago as shown on the above chart by the red oval.

When this sort of activity occurs in more than one overseas market, then it's time to closely watch the strength of the US Stock Market as well. We'll examine the US Market in the next post. Stay tuned!


While 'Excalibur' picks amazing reversal price points, it also does something else of equal importance . . .

'Excalibur' can also target highly probable price objectives (tops and bottoms) as well!

The chart displayed is an example of what can be done once one has learned one of the unique tools offered on this website, If you're interested in acquiring a licensed copy of Excalibur or one of my other courses for your own use, send me an e-mail - George

Those of you who are sincerely interested in taking in some of the courses offered are encouraged to e-mail me HERE. - George

India Nifty 50 Near Pivot Point

      The Nifty 50 Trend Begins To Weaken

      This Market Has Been Weakening & Bears Watching.

Paper Assets Are Now The Greatest Portion Of Wealth In Over 90-Years

By George R. Harrison

Major Market Trends (like that seen in the Nifty 50) need to take a 'breather'; a pause to regain it's momentum before continuing onwards.

The Nifty 50 has had a spectacular run thus far and has only in the last few weeks begun to show a definite weakening. This is largely invisible to others, but, when applying 'The Excalibur Trading Method' for market analysis (as we've done for years now successfully), we can clearly detect a slowing in price momentum is already taking place. Are you one of the select few who can see it?

If you're already a student of one of our unique and proprietary trading methods, you certainly are able to see what's happening and are taking preparations accordingly. This while most others see nothing at all unusual happening. Referring to the chart above, we can see that the shift to the downside has not taken place as yet (as of the time of securing this chart for analysis). So, there's time to prepare.

The lower red horizontal line at the 9,000 price level is the price point to watch for a definitive shift in trend to the downside. We're not there as yet, but, the close proximity of this price point combined with the weakening of market price momentum means that we should be watching closely and not be surprised should this price point be penetrated by a Closing price or a bar whose range is completely below the 9,000 price point.

While 'Excalibur' picks amazing reversal price points, it also does something else of equal importance . . .

'Excalibur' can also target highly probable price objectives (tops and bottoms) as well!

In our chart above, we've done just that by showing that, if enough energy is recovered, prices will rise up to 9,400 on their next upsurge. Here again, this assumes that the 9,000 price point is not broken first.

The chart displayed is an example of what can be done once one has learned one of the unique tools offered on this website, If you're interested in acquiring a licensed copy of Excalibur or one of my other courses for your own use, send me an e-mail - George

Consider clicking on the 'Master Trading Courses' at the top of this page and use the drop down menu to find more information and testimonials about the special trading methods offered only here.

The Age of Paper Wealth

      A Trend That Is Largely Invisible To Investors

      Our World Today Is Increasingly Relying On Financial Paper . .

     . . . As We Define Our Total Wealth With Largely Paper Assets

Paper Assets Are Now The Greatest Portion Of Wealth In Over 90-Years

By George R. Harrison

I generally make a point of not following the crowd. Actually, I should rephrase that to read: My chart analysis seldom puts me on the same side of the market as the popular press. If ever there was a market 'rule' then 'not following the crowd' is certainly one that gets a lot of circulation. It's also one that almost everyone ignores. With all the press confusion, it's no wonder. You need the tools to make your own decisions.

It's good to be as fully aware of one's investing environment as possible and, with that in mind, we're taking a look today at an area of the investment arena that hardly comes up at all on people's radar screen.This article is about a very long-term trend but, this trend is not about prices but about the economy and personal investment habits. We're so immersed in this flow that we've never really thought much about it as the time periods over which the currents reverse are relatively long.

However, we're now approaching one of those current reversal times and it's a good time to take stock of where we are and where we've come from.

As shown on the chart above, we're reaching new highs when it comes to accumulating our assets in paper or Financial Asset form (like Stocks and Bonds) versus having our assets and wealth in Real Assets like Real Estate or Commodities.

Periods of inflation and deflation have had a good deal to do with this, but, also new generations of traders and investors who know of no other way in which to accumulate value for themselves.

Inflation raises the value of Real Assets (through higher Real Estate and Commodity prices) and so accounts for the big dip in paper assets on the chart around 1980 (the most recent peak of high interest rates and inflation).

Deflation increases the value of Financial (Stocks & Bonds) Assets. This was the big trend and worry during the Depression of the 1930's and we see the same rising effect on paper assets shown on the chart. And, there has been a big deflation in Commodities prices just like there was in the 1930's. But, it's good to remember that no trend lasts forever and the swing towards Paper Assets like Stocks and the Stock Market will eventually end and prove this point yet again. Note on the chart how we've been in a rising Financial (Paper) Asset environment now for almost 30-Years. That's a longer run than we see on this chart over it's 90-Year period.

This chart is a bit top-heavy in my opinion. Bonds can be made more attractive only by raising interest rates which will, in turn, tend to dampen the stock market. However, during war times, the US is still a refuge for lots of investment funds and Bonds are the way this is usually done. So, this will have to monitored carefully to see which way the wind blows (and how strongly).

It just makes sense that too many investors in too narrow a field of investment spells high risk. The better part of Wisdom is to diversify some assets into the REAL ASSETS field like Commodities (which are just starting to come to life again). The Financial or Paper Market for assets has a nasty habit of evaporating on stock market reversals. A lot of time is lost coming back from these set-backs.

We're already in record territory on the chart shown which is comparing the Stock Market S&P 500 to the CRB Commodities Index. This means that we have to be especially vigilant when monitoring our individual stock charts and the index charts. These are the times to make good use of the Unique Market Tools that are offered ONLY on this website. I've helped many students to learn these special trading methods (which were discovered over the last half-century) from all over the world. These open-minded students have learned and achieved much. Take some time to read just some of the Testimonials to get some idea for yourself.


Any of the Courses mentioned on this web page like the 'Stairway, Excalibur, The Exponential or Intraday Trading Secrets' will be a big assistance in tracking the big price trends as well as the intraday conditions and minor trends. Whichever time frame you're following; you'll need the best help you can get. Consider clicking on the 'Master Trading Courses' at the top of this page and use the drop down menu to find more information and testimonials about the special trading methods offered only here.

These are some of the methods that can be applied to intraday trading quite precisely (see the chart above for example). I'm offering it to you today.

I offer a special Collection price for these methods and three additional ones (contained within The 'Intraday Trading Secrets' Course), please send me an e-mail requesting additional details and pricing. - George

Special Collection of Day Trading Methods

      Our Intra-day Trading Method Collection  

      Intraday 'Stairway' Trading Signals for The Gold Market 

Intraday 'Stairway Trading Point' For GOLD

By George R. Harrison

More readers have been expressing interest in the day trading applications of my trading methods. I'll present to you now what I'll call The Day Trading Method Collection'. 

Today's volatile markets offer endless opportunities for short-term traders, but, one has to have some pretty special tools to detect the fast-moving turns in price that are now a normal part of day trading and the markets as we find them. The GOLD market intraday is shown in the above chart and the BUY point for GOLD using 'The Stairway Trading Method' for our market analysis is indicated by the red circle.

'The Stairway Trading Method' follows markets both up and down. Intra-day, Daily or at longer time frames for major trends (where it shines brilliantly!). This BUY was given early enough to catch a big rise in prices over the next hour and a new stop is still in place as this method indicates that there is still strong momentum locked up within the market which may go still higher.


 'The Exponential Timing Method:

The next trading technique I'll showcase here is from another technique developed some years back which has the ability to follow fast moving markets very closely with a stop or reversal point. It's called 'The Exponential Timing Method' and it's results are exactly that . . . Exponential.


.

These are some of the methods that can be applied to intraday trading quite precisely (see the chart above for example). I'm offering it to you today.

I offer a special Collection price for these methods and three additional ones (contained within The 'Intraday Trading Secrets' Course), please send me an e-mail requesting additional details and pricing. - George

1 38 39 40 41 42 58