Tag Archives for " The Levitas Principle trading course "

Short-term Trading Opportunities Abound For Day-Trading Crude Oil

Today's chart is an Hourly price chart for Crude Oil.
This time, we've located a SELL Signal price point using our proprietary 'Intra-day Solar Trader Analysis Method.


CRUDE OIL: HOT ENOUGH TO PROVIDE PROFIT SHOTS DAILY

We have a sophisticated, low-profile technique to ferret out juicy, high-profit potential turning points in trend for day traders as well as longer term traders.

The 'Intra-day Solar Trader' Rolls Back the Market 'Curtain'.

Instead of hanging back and becoming a victim of the Economy, why not step up and take control of your Economic future instead and be pro-active in digging out the profits that are still there waiting to be discovered and mined each and every day?

Whether you trade full-contract sizes or use minis or micro contracts, the point is to play this Game strategically and successfully and, to do that, you're going to need BETTER techniques than the next guy has or will ever have.

That's exactly what I'm offering a few of you dedicated traders and investors today.

The 'Intra-day Solar Trader'

Your Long-Awaited Ticket To 'Big League' Trading Results

Work 'From Home'; Profit From Home


If you want to take advantage of the 'work from home' environment that's being forced on most of the world lately, and, you're a trader with some experience who knows the basics of the Craft, then, this is a rare opportunity to leave the masses of other traders with their poor results far, far behind and to embrace a brand New Doorway to Knowledge and Performance (read the Testimonials) in your trading results.

During this whole panic period, we've stood firm in offering our Clients and Students a way forward to the future; a Brand New Day of Excellent Trading Results using our proven courses like the 'Intra-day Solar Trader' Day-trading Course.

  • This Course comes with 24-Months (that's 2-Years Folks!) of personal support and question answering from the creator and author of the Course, me. That's just unprecedented Support in this day and age. Look around and you'll soon discover the Truth of that statement.


  • This is a Private Course and, these techniques are not available to the masses of investors or traders. Our Premium Donation Levels assure that these hard-won discoveries will be kept away from all but the most professional of traders and investors. In addition, our Clients are protected by a strong Non-Disclosure Agreement (NDA) that will severely penalize any breach of security or privacy.

If you want to take full advantage of the 'work from home' environment that's being forced on most of the world lately, and, you're a trader with some experience who knows the basics of the Craft, then, this is a rare opportunity to leave the masses of other traders with their poor results far, far behind and to embrace a brand New Doorway to Knowledge and Performance (read the Testimonials) in your trading results.

During this whole 'panic' (them, not us) period, we've stood firm in offering our Clients and Students a way forward to the future; a Brand New Day of Excellent Trading Results using proven courses like the 'Intra-day Solar Trader' Day-trading Course.

SPECIAL: I have a very special offer for this outstanding trading method shown above. This is an amazingly powerful trading technique and analysis tool that was derived from my over Half-A-Century of Research into W.D. Gann's Lost Trading Secrets, THIS IS YOUR CHANCE TO LEARN & APPLY THEM IN YOUR TRADING BUSINESS. E-mail me below.

THIS IS YOUR CHANCE TO LEARN & APPLY IT TO YOUR OWN TRADING BUSINESS. 


Contact me at the e-mail address below and get started today. - George

Enter your text here...


Watch for a Rise in the US Dollar in the Weeks Ahead

In a earlier posting, we speculated that signs point to a declining trend in the EURO post Election and that this would, in turn, seem to indicate that a rise in the value of the US DOLLAR would also take place.
This time, I've taken a look directly at the US DOLLAR Index chart itself to see if it could offer any clues that either contradict or confirm the earlier readings from the EURO.


THE US DOLLAR INDEX PRICE TREND HAS JUST STARTED TO SHIFT UPWARDS: NEXT IS A CONFIRMATION SIGNAL.

Although the indication is early, I did detect an upwards shift in price momentum even if recent prices have been lower. So, this would be in line with our earlier EURO reading, commentary and expectations.

Markets Can Often Give Clues As To Coming Events.

The US DOLLAR INDEX price trend can reflect as an indicator for the upcoming State of the Economy.

What would a rising US Dollar represent?

This would indicate that the Economy for the US will be greatly strengthening and that Recovery is in the cards; essentially, 'Baked in the Cake' already when looking at the underlying momentum to the trend.

Again, these comments are an educational exercise and my personal opinion only (an enlightening process I've been engaged in for over half-a-century now!). Although I'm pretty sure of my analysis, I do not advise others and am not an licensed advisor. Read our Disclaimer to that effect.

This will wind up our longer-term outlook series for some major markets. If we missed your favorite Market, drop us an email with the market you'd like us to examine.


Learn How to Look Forward into the Future


The above chart is a Weekly Price Chart.

As we stated in our previous posts, this longer time scale allows us to sift out price momentum, (whether up or down), more efficiently.

The new uptrend in the US DOLLAR INDEX is what we're watching. Look for a confirmation of the Uptrend if prices for the US Dollar Index rise and close above the dotted line above the present price action on the chart above.

Trends are powerful things and, the ability to get on board a rising or falling trend is where the big returns are historically. We have superior, one-of-a-kind trading methods, analytical tools and educational materials that will instruct you on how to detect these potentially profitable points in time early.

Our Proprietary half-century of research is now available to a few private clients.

You can gain access to our Excellent Trading Courses or our Master Course Collection today.

Allow yourself to discover our excellent trading methods and techniques that are truly unique and World Class. If these are what you're looking for, please feel free to inquire about our special Gift Donation Access Program for any of these powerful courses as well. - George

SPECIAL: I have a very special offer for the 3-Course Set shown above. These are amazingly powerful trading techniques and analysis tools, THIS IS YOUR CHANCE TO LEARN & APPLY THEM IN YOUR TRADING BUSINESS. E-mail me below. - George


Contact me at the e-mail address below and get started today. - George

Enter your text here...


Don’t Be Fooled: The Pre-Winter Natural Gas Price ‘Trap’

Don't get fooled by the high prices in Natural Gas at present. It's the Season for high prices in this Winter commodity. Observe the Seasonal Price Chart below and focus on what prices do on average in October of each Year.
This Year, there's going to be a major oversupply of Energy products from Crude Oil to Natural Gas as many, many businesses have closed down due to the pandemic overreactions.
This is going to have a depressing price effect on Natural Gas I would think, and, as our projection earlier this week was for a slide in Crude Oil prices as well, then, this current peak in Natural Gas (occurring at the expected Peak time of the Season), aligns well with an expected decrease in prices for both energy sectors.


NATURAL GAS PRICE TRENDS ARE STILL UP, BUT, THIS IS THE EXPECTED TIME OF THE YEAR FOR A PRICE PEAK.

Though the current price uptrend for Natural Gas is strong, it bears close watching for the expect top in price that seasonally occurs at this time of year.

Always Stay Conscious of the Price History of a Commodity.

The NATURAL GAS MARKET price trend can reflect as an indicator for the current State of the Economy.

Presently, we're yet to come out of our 'locked-down' economic state completely.

There's a lot of energy inventory to clear up before prices can firm up, and, still another Peace Initiative has been successfully negotiated by the Trump Administration in the general Middle East area which lowers even further the risk of war in the region. This is bearish for energy prices in general.

Again, these comments are an educational exercise and my personal opinion only (an enlightening process I've been engaged in for over half-a-century now!). Although I'm pretty sure of my analysis, I do not advise others and am not an licensed advisor. Read our Disclaimer to that effect.

But, for those who have requested it, I'll continue to evaluate a few more markets in the days to come just to get a better 'feel' for the actual trends versus the perceived trends in some of the more popular markets.


Learn How to Look Forward into the Future


The above chart is Weekly Price Chart.

As we stated in our previous posts, this longer time scale allows us to sift out price momentum, (whether up or down), more efficiently.

The current and long-term uptrend in Natural Gas appears could well be the normal peak in prices that occurrs every year at this time, and, so, may not be a part of a greater price trend drive upwards at all.

Trends are powerful things and, the ability to get on board a rising or falling trend is where the big returns are historically. We have the tools and educational materials that will instruct you on how to detect these potentially profitable points in time early.

Our Proprietary half-century of research is now available to a few private clients.

You can gain access to our Excellent Trading Courses or our Master Course Collection today.

Allow yourself to discover our excellent trading methods and techniques that are truly unique and World Class. If these are what you're looking for, please feel free to inquire about our special Gift Donation Access Program for any of these powerful courses as well. - George

SPECIAL: I have a very special offer for the 3-Course Set shown above. These are amazingly powerful trading techniques and analysis tools, THIS IS YOUR CHANCE TO LEARN & APPLY THEM IN YOUR TRADING BUSINESS. E-mail me below. - George


Contact me at the e-mail address below and get started today. - George

Enter your text here...


Stock Market Slowing a bit, But the Long-Term Up Trend Still Intact


THE STOCK MARKET IS WEAKENING SLIGHTLY, BUT, THE LONGER-TERM UPTREND IS STILL INTACT AND RUNNING.

This Stock Market Is Getting Slightly Softer.

The STOCK MARKET price trend is often a future indicator for the State of the Economy.

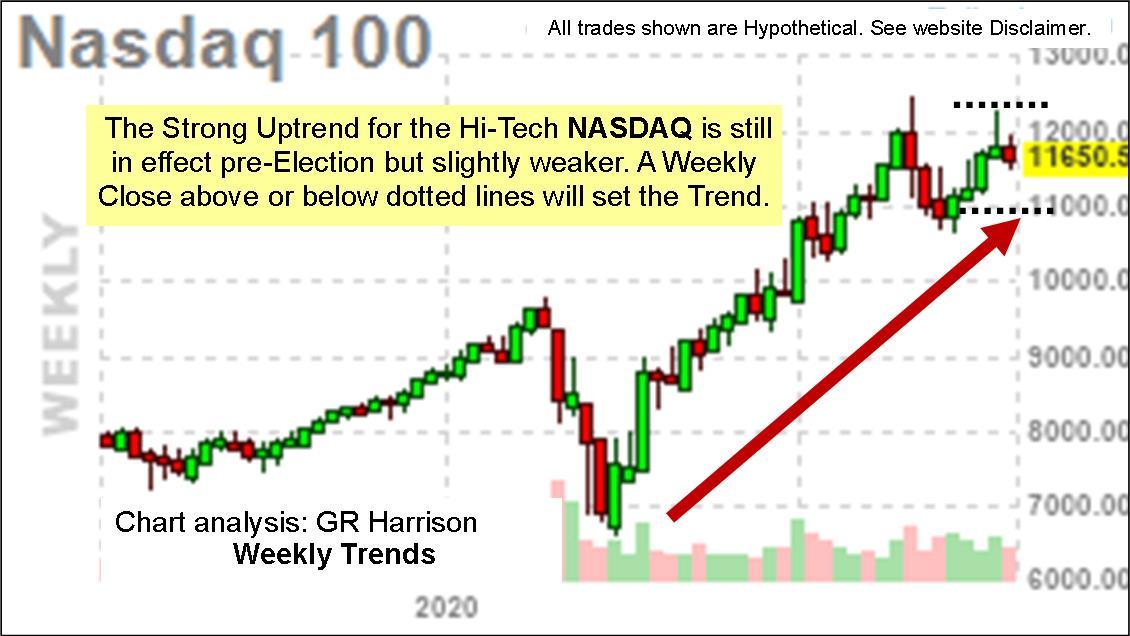
Price movement paused briefly recently, but, should prices for the Weekly Close go above the price level indicated by the dotted line above the present price, we'll have re-sprung back into a strong uptrend again.

I won't pretend to interpret this Market relative to the upcoming Election as to meaning, but, as the market has gone up all during the present administration, for the market to continue in that same direction would seem to indicate that conditions in the future are expecting to duplicate those of the past 4-Years. Read into that what you will, but, try to remain unbiased in your interpretation.

Watch for prices breaking below the lowest dotted line level on a Weekly Closing basis to confirm a break in the uptrend. 

Again, these comments are an educational exercise and my personal opinion only (an enlightening process I've been engaged in for over half-a-century now!). Although I'm pretty sure of my analysis, I do not advise others and am not an licensed advisor. Read our Disclaimer to that effect.

But, for those who have requested it, I'll continue to evaluate a few more markets in the days to come just to get a better 'feel' for the actual trends versus the perceived trends in some of the more popular markets.


Learn How to Look Forward into the Future


The above charts for the two Stock Market Indexes are Weekly Price Charts.

As we stated in our previous post, this longer time scale allows us to sift out price momentum whether up or down more efficiently.

The current and long-term uptrend in these Stock Indices appear to be poised to continue, although, there has been a slight pause in their momentum these last few weeks.

If there is going to be drop in the Market, it'll be more believable if prices drop, (on a closing basis), below the lower dotted lines on both charts. Price drops into this region, will tend to confirm that the slowdown or weakness is building and that a break in the Markets is coming.

Trends are powerful things and, the ability to get on board a rising or falling trend is where the big returns are historically. We have the tools and educational materials that will instruct you on how to detect these potentially profitable points in time early.

Our Proprietary half-century of research is now available to a few private clients.

You can gain access to our Excellent Trading Courses or our Master Course Collection today.

Allow yourself to discover our excellent trading methods and techniques that are truly unique and World Class. If these are what you're looking for, please feel free to inquire about our special Gift Donation Access Program for any of these powerful courses as well. - George


Contact me at the e-mail address below and get started today. - George

Enter your text here...


The Current Crude Oil Price Trend


CRUDE OIL IS WEAKENING. WATCH FOR A BREAKDOWN.

This Sideways Market Is Getting Softer.

Crude Oil price trends are a political and industrial indicator.

Watch current prices very closely. We've reached a pivotal point in price where a break-down in prices could start an avalanche downwards in price trend.

Looking towards the Election again, we could read that an impending downswing in crude oil prices would likely follow greater stability in the Middle East. There have been unprecedented peace treaties signed recently in that region, and, this downwards tendency for the Crude Oil Market seems to imply that great stability could be coming following the Election, meaning further, that what has been accomplished there will continue to expand politically.

Watch for prices breaking below the $34 level on a Weekly basis to confirm a serious downtrend. Actually, this downwards trend will be suggested even earlier if price drops below $38 on the weekly close.

Again, these comments are an educational exercise and my personal opinion only (an enlightening process I've been engaged in for over half-a-century now!). Although I'm pretty sure of my analysis, I do not advise and am not an advisor. Read our Disclaimer to that effect.

But, for those who have requested it, I'll continue to evaluate a few more markets in the days to come just to get a better 'feel' for the actual trends versus the perceived trends in some of the more popular markets.


Learn How to Look Forward into the Future


The above chart for CRUDE OIL is a Weekly Price Chart.

As we stated in our previous post, this longer time scale allows us to sift out price momentum whether up or down more efficiently.

The current impending downtrend in  CRUDE OIL that we're detecting is, as stated above, probably an indication of an expected continuation of the past 4-years of diplomacy at this time. If trends continue dwards post election, then, this would likely confirm an even stronger dive downwards in price is in the works.

Trends are powerful things and, the ability to get on board a rising or falling trend is where the big returns are historically. We have the tools and educational materials that will instruct you on how to detect these potentially profitable points in time early.

Our Proprietary half-century of research is now available to a few private clients.

You can gain access to our Excellent Trading Courses or our Master Course Collection today.

Allow yourself to discover our excellent trading methods and techniques that are truly unique and World Class. If these are what you're looking for, please feel free to inquire about our special Gift Donation Access Program for any of these powerful courses as well. - George


Contact me at the e-mail address below and get started today. - George

Enter your text here...


Bitcoin Up Trend Continues Towards the Election


AN EMOTIONAL INDICATOR SHOWS AN UPTREND

Bitcoin Still Strong Going Forward

Like Gold, Bitcoin too is an emotional market.

The current strengthening of Bitcoin is a little bit out of phase with our earlier analyzed markets and a bit harder to 'read' I think.

Because Bitcoin is a populist product and taps deeply into the psyche of it's holder's feelings, my read would be that the continuing of the rising trend in prices can be attributed to 'uncertainty' in the future and in the Election coming up particularly.

Watch for prices breaking below the $10,000 level on a Weekly basis to confirm a reversal of this current upwards price trend.

Again, this is an educational exercise and my personal opinion only. An educational process I've been engaged in for over half-a-century now. Although I'm pretty sure of my analysis, I do not advise and am not an advisor. Read our Disclaimer to that effect.

But, for those interested, I'll continue to evaluate a few more markets in the days to come just to get a better 'feel' for the actual trends versus the perceived trends in some of the more popular markets.


Learn How to Look Forward into the Future


The above chart for BITCOIN is a Weekly Price Chart.

As we stated in our previous post, this longer time scale allows us to sift out price momentum whether up or down more efficiently.

The current Uptrend in  BITCOIN that we're detecting is, as stated above, probably more an indication of caution and uncertainty at this time. If trends continue upwards post election, then, this would likely confirm an even stronger drive upwards in price is in the works.

Trends are powerful things and, the ability to get on board a rising or falling trend is where the big returns are historically. We have the tools and educational materials that will instruct you on how to detect these potentially profitable points in time early.

Our Proprietary half-century of research is now available to a few private clients.

You can gain access to our Excellent Trading Courses or our Master Course Collection today.

Allow yourself to discover our excellent trading methods and techniques that are truly unique and World Class. If these are what you're looking for, please feel free to inquire about our special Gift Donation Access Program for any of these powerful courses as well. - George


Contact me at the e-mail address below and get started today. - George

Enter your text here...


Post Election GOLD Trends


ANOTHER EMOTIONAL INDICATOR SHOWS A DOWNTREND

GOLD Prices are Currently Weakening

Gold is an emotional metal.

The current weakening state of GOLD is giving a hint of how the US Election is going to turn out.

This is another case of the markets, when read carefully, giving a glimpse of the future outcome of events-yet-to-come.

Watch for prices breaking below the $1840 level to confirm an acceleration of this weakening Gold price trend.

Again, this is an educational exercise and my personal opinion only. An educational process I've been engaged in for over half-a-century now. Although I'm pretty sure of my analysis, I do not advise and am not an advisor. Read our Disclaimer to that effect.

But, for those interested, this is my current view of the major markets for the period extending over the next few weeks remaining before the US Election takes place.


Learn How to Look Forward into the Future


The above chart for GOLD is a Weekly Price Chart.

As we stated in our previous post, this longer time scale allows us to sift out price momentum whether up or down more efficiently.

The current downtrend in GOLD that we're detecting goes along with our observation and expectation for a strengthening of the US DOLLAR and the US STOCK MARKET and a corresponding drop in the dollar's competitor, the EURO.

Trends are powerful things and, the ability to get on board a rising or falling trend is where the big returns are historically. We have the tools and educational materials that will instruct you on how to detect these potentially profitable points in time early.

Our Proprietary half-century of research is now available to a few private clients.

You can gain access to our Excellent Trading Courses or our Master Course Collection today.

If these 3 analyses crystallize, it will point to a stronger US Economy and will have a positive effect on the Global Economy in return. Let's root for this result for all our sakes.

Allow yourself to discover our excellent trading methods and techniques that are truly unique and World Class. If these are what you're looking for, please feel free to inquire about our special Gift Donation Access Program for any of these powerful courses as well. - George


Contact me at the e-mail address below and get started today. - George

Enter your text here...


Is The EURO Going Lower After the Election?

IS THERE GOING TO BE AN 'ELECTION SURPRISE' FOR THE EURO?

. . . THERE ARE STRONG SIGNS THE EURO IS GOING DOWN!

Currencies, especially the major currencies have been busily pricing in the results of the upcoming election even before it occurs.

The current weakening state of the Euro is giving a hint of how the US Election is going to turn out.

This is another case of the markets, when read carefully, giving a glimpse of the future outcome of events-yet-to-come.

Watch for prices reaching the 1.1600 level to confirm this weakening market trend.

This is an educational exercise only. We do not advise and are not advisors. Read our Disclaimer to that effect. But, for those interested, this is the current level of primary interest over the next few weeks remaining before the US Election takes place.

Be More Informed and Less Fearful of the Future

The above chart for the Euro is a Weekly Price Chart.

This longer time scale allows us to sift out price momentum whether up or down more efficiently.

A drop in the EURO will imply a strengthening of the US DOLLAR to compensate for this movement.

Trends are powerful things and, the ability to get on board a rising or falling trend is where the big returns are historically. We have the tools and educational materials that will instruct you on how to detect these potentially profitable points in time early.

Our Proprietary half-century of research is now available to a few private clients.

You can gain access to our Excellent Trading Courses or our Master Course Collection today.

We're allowing Limited Access to these private discoveries through our Special Gift Program.

The 'Master Course' Special Gift Installment Program

As stated on our HOME PAGE, we've now cleared access for up to two new client/students each month for our Master Course Collection at a very special gift request level.

Here's What You'll Receive With Our Special Gift Program

This Special Gift Program will allow you to receive the courses either all-at-once or on an installment gift basis (if you wish to assimilate the information over a longer period of time).

We also have excellent, one-of-a-kind trading methods and techniques that are World Class. If these are what you're looking for, please feel free to inquire about our special Gift Donation Access Program for any of these powerful courses as well. - George

Enter your text here...

Contact me at the e-mail address below and get started today. - George

Enter your text here...


Election Year Cycles for the Stock Market

AN ELECTION-YEAR RALLY IS THE 'RULE', NOT THE EXCEPTION

. . . THAT'S WHAT WHAT THIS CYCLE DOES HISTORICALLY!

Building upon our previous post, we find further evidence that shifts probabilities for a strong Stock Market Rally in our favor with the examination of a historical cycle for the stock market during Election Years like this one.

The Election Year chart at the top of this article is founded on 116-Years of data!

This shouldn't be treated lightly, but, always remember that all cycles break at some point in time and, that's why we use more than once corroborating historical base and method to confirm and follow these trends.

Be More Informed and Less Fearful of the Future

Knowing the Historical Cycles and repetitive themes of the markets can have a calming effect overall when one is contemplating the markets.

This will put you in a truly small group of those investors who can calmly assess and react to the market while ignoring the panic headlines and crowd mentality.

Most will indeed be 'surprised' by a strong Market going towards the elections.

Trends are powerful things and, the ability to get on board a rising or falling trend is where the big returns are historically. We have the tools and educational materials that will instruct you on how to detect these potentially profitable points in time early.

Our Proprietary half-century of research is now available to a few private clients.

You can gain access to our Excellent Trading Courses or our Master Course Collection today.

We're allowing Limited Access to these private discoveries through our Special Gift Program.

The 'Master Course' Special Gift Installment Program

As stated on our HOME PAGE, we've now cleared access for up to two new client/students each month for our Master Course Collection at a very special gift request level.

Here's What You'll Receive With Our Special Gift Program

This Special Gift Program will allow you to receive the courses either all-at-once or on an installment gift basis (if you wish to assimilate the information over a longer period of time).

Enter your text here...

Contact me at the e-mail address below and get started today. - George

Enter your text here...


The Market’s REAL October Surprise

NO ONE EXPECTS THE STOCK MARKET TO RISE IN OCTOBER

. . . BUT, THAT'S WHAT IT DOES HISTORICALLY!

The Media is generally the enemy of the individual, independent investor.

They can't help it as they're sponsored by big institutions who have their own profit agendas in the markets.

Institutional Sellers must create more Buyers at still lower prices and as Buyers must create a large number of Sellers in order to take profits off-the-table at intervals and to increase the inventory of shares available for purchase.

They do this by manipulating perceptions using the Media as one tool for example.

By creating alarm and fear of 'impending' crashes in the market, the insiders can create more liquidity by tricking owners of stock to let go of their shares out of fear, only to have those shares scooped up by the big Buyers who then drive the Stock Market up to new higher highs.

We're presently seeing this very action taking place disguised by all the other distractions of the day (pandemics, elections, etc.)

The Market Magicians Are Trying To Distract You

The current price chart shown above shows that we've ALREADY started the upswing that usually takes place at the end of October historically.

This means that we currently have a Market that is ahead of schedule but, still on course to follow it's normal upwards swing for the end of the year.

So, how do you make use of this Seasonal information as a guide to the future?

Essentially, you simply note that, over a 30-year period, stock prices have followed the general tendency to Fall from Summer into October, then, rise from that point forwards into the New Year.

Then, note what price action has been in the market and see if the trends match up closely.

Seasonal charts are 'guidelines' or averages, so, the timing may be a little early or slightly later without altering the general trend expected.

In the case of  this year, the Market has been so strong that the uptrend actually started in September instead of October.

Further confirmation will be achieved when prices take out on a Closing basis the Highs of September.

Most will indeed be 'surprised' by a strong Market going towards the elections. The Press is certainly rooting for a crash in the economy, but, when was the last time they've been proven right on anything?'

Further confirmation for what to expect. Go Opposite the Media's stance.

Trends are powerful things and, the ability to get on board a rising or falling trend is where the big returns are historically. We have the tools and educational materials that will instruct you on how to detect these potentially profitable points in time early.

Our Proprietary half-century of research is now available to a few private clients.

You can gain access to our Excellent Trading Courses or our Master Course Collection today.

We're allowing Limited Access to these private discoveries through our Special Donation Program.

The 'Master Course' Special Donation Installment Program

As stated on our HOME PAGE, we've now cleared access for up to two new client/students each month for our Master Course Collection at a very special donation request level.

Here's What You'll Receive With Our Special Donation Program

This Special Donation Program will allow you to receive the courses either all-at-once or on an installment donation basis (if you wish to assimilate the information over a longer period of time).

Enter your text here...

Contact me at the e-mail address below and get started today. - George

Enter your text here...

The Stock Market Rebounds


THE STOCK MARKET REBOUNDS - AGAIN

Well, we should be used to it by now. Again, the Market has outwitted the experts.

Just when you think that it's down . . . It comes roaring back up one more time.

Using the Dow Chart above and one of our proprietary trading indicators (Excalibur I, part of our 'Master Course' Collection), we see that prices, even during their decline, failed to go through and close below our indicated Support Price Angle Line.

Here again, the public was lead to worry instead of being taught to use the momentum of actual Price History to come to conclusions about the strength or weakness of the Stock Market in general.

By learning this Powerful Trading Technique, you would have had an EARLY warning of just which price area to watch particularly closely as well as, what to watch for!

The DJIA remains strong and has re-bounded upwards from a strengthening support price level.

Enter your text here...

Depend on Dependable Indicators

Dependable Indicators that lie outside the public and popular domain are our specialty discoveries. The Pros know where the public has it's orders and which indicators they're using.

Our Indicators are unknown to the Pros and aren't used by the Public at all. 

Want to learn how you can also find KEY trading pivot points like that shown above for your favorite Markets?

You can gain access to our Excellent Trading Courses or our Master Course Collection today.

We're allowing Limited Access to these private discoveries through our Special Donation Program.

The 'Master Course' Special Donation Program

As stated on our HOME PAGE, we've now cleared access for up to two new client/students for our Master Course Collection at a very special donation request level.

Here's What You'll Receive With Our Special Donation Program

This Special Donation Program will allow you to receive the courses either all-at-once or on an installment donation basis (if you wish to assimilate the information over a longer period of time).

Enter your text here...

Contact me at the e-mail address below and get started today. - George

Enter your text here...


The Major Stock Index Trends To Consider


As the above chart shows and our previous post indicated, the S&P 500 is still in it's uptrend even after taking a slight dip), when looking at the Stronger Weekly Price Trends. Price remains strongly above the red support line on the chart.


The Russell 2000 gives us a much broader look at the health of the Stock Market. This Market is staying well above it's red support line meaning that the overall stronger price trend is still upwards.


The Nasdaq 100 represents the Tech Stock arena which has been the hottest of the 3 markets as 

reported by us in a previous posting.

Of the 3 markets shown on the charts above, only the Nasdaq 100 is the weaker, presently resting on it's red support line. This may be the one market which breaks even while the others remain strong for the present.

Use these charts to build your confidence and to change your mindset to a positive one based on this reality which the price charts present to us. The effects of doing so will be beneficial to you.


Imagine Winning, It's more Important than you know!

Everything begins with Imagination. You must hold the image of the Goal already achieved! Practice this without fail and you'll be most amazed and pleased.

Want to learn how you can also find these KEY trading pivot points in the Markets?

You'll find the courses you'll need in our 'Getting Back To Trading' Special Offer.

ACT TODAY. There's NO TIME TO WASTE . . .

Contact me at the e-mail address below to get started. - Excellent Trading. - George


Is The Worst ALREADY Over?


  We're ALREADY In An Upswing From the Liquidity Lows!

Public Perceptions Lag the Reality. The Drought is Probably Over Already!

The Global Financial Panic of 2008 was nasty. It took many years to recover from it.

However, recover we did.


Here's the Great News; Our Angle of Recovery Now is Even Faster than 2008.

If you'll examine the chart above on the stock market's liquidity, you'll see that we've already upsurged from the lowest low in liquidity since the 2008 Panic. And, rapidly at that.

Money is coming back into the Markets in a big way now. This is a fundamental condition that underlies the actual prices we see in the Markets.

The market may still swing down (and, has these last weeks), especially going into the months of September & October, but, the true underlying condition of the Market is better indicated by looking at the actual liquidity of the Markets. Whether money is going into or out of the Market overall.

Look at the chart and change your mindset to a positive one based on this reality and not negative fake 'news'. The effects of doing so are only beneficial to you.

      Stay Upbeat and Positive Mentally and Spiritually!

Visualize Financial Victory!

Everything begins with Imagination. You must hold the image of the Goal already achieved!

You may also take part in this 'Getting Back To Trading' Special Offer.

ACT TODAY. There's NO TIME TO WASTE . . .

Contact me at the e-mail address below to get started. - Excellent Trading. - George