George Harrison

Not Every Price Is Equal
NOT EVERY PRICE IS EQUAL
One of the grandest errors of so-call ‘modern economics’ occurred from extending the social, ‘feel-good’ concept of ‘equality’ to the analysis of markets and market prices.
The Truth? The Truth is that every price is inherently NOT equal in the information it’s trying to convey.
And, one price is not equal to another price in what it bodes for the future movement of trend either. WD Gann understood this and there are few others today who either consider it or comprehend it.
There’s a different kind of analysis that’s ruthlessly consistent in what it ignores which so many consider to be important. It’s this kind of approach that makes the work done on this site and taught through the course materials here stand out from the rest.
Let’s look at the e-mini for today’s example:
 The upwards bias for prices is still intact and will remain so as long as prices don’t drop below the 2054 price line.
As more buying comes into the market, we’ll be alerted by prices advancing above the 2064 price line which will promise even higher prices ahead. – George
Welcome to our End-of-the-Year Specials.
Each year’s end, for years now, I’ve offered a special deal on my course materials (including the Master Course itself) for those getting ready for the year of trading to come.
The Year 2015 will offer special profit opportunities for those who are:
- Skilled enough to see them,
- Patient enough to stalk the setups
- Fast enough to seize those opportunities and
- Satisfied enough to walk away with profit.
I CAN HELP YOU WITH THE FIRST POINT: SKILL & KNOWLEDGE OF THE MARKETS.
Your skill doesn’t improve by watching me point out the next market opportunity.
Until you take it upon yourself to learn the skills for yourself and apply those skills, trading will remain only a spectator sport.
THIS IS THE TIME.
PRICE WON’T GET BETTER,
SO, WHAT’S YOUR EXCUSE FOR NOT ACTING?
Whether, it’s the Excalibur Method, individual Modules from the Harrison-Gann Trade Secrets Master Course or the entire Master Course itself.
This is the time to step up and decide what kind of New Year you intend 2015 to be.
Contact me here if you’re serious and wish to make your commitment to learning and to let that commitment be your statement about your future expectations and demands.
Happy Holidays and best wishes,
George
![]()
Gold Price Prediction Met
THE GOLD PRICE PREDICTION WAS MET FROM OUR PREVIOUS MEMBER’S PRIVATE POST
Our private members were able to see this chart a few days ago:

Chart courtesy of Finviz.com . Charts are displayed for educational purposes only. Read Disclaimer.
This was the predictive chart for the unknown future that only our private members had access to.
Let’s see what happened . . .

Chart courtesy of Finviz.co . Charts are displayed for educational purposes only. Read Disclaimer.
![]()
Crude Oil Prices Hit ‘Wall of Time’
This is post is republished from our WDGann-Lost-Secrets.com website
CRUDE OIL PRICES HAVE NOW HIT A ‘WALL OF TIME’
Crude Oil prices have now entered a crucial price zone. In fact, prices have hit what I call a ‘Wall of Time’ which makes further sideways price movements difficult to sustain.

Chart courtesy of Finviz.com. All charts are for educational purposes only.
SELECT ACCESS TO MEMBERS ONLY
As to what will follow for Crude Oil prices, that’s reserved for the private members section of this post.
JOIN TODAY and stop guessing what the market’s are going to do next. Learn and anticipate the major market moves.
The initial trial membership level is Free, but, you have to take action and sign up.
Are you just a passive reader or are you looking to seriously engage the markets using knowledge and the laws of market behavior?
Don’t Stay in the Dark: JOIN HERE TO SEE THE CRUDE OIL CHART AND COMMENTS.
What Follows is Reserved for Members of the WD Gann Traders Group . . .
[private_WD Gann Trading Secrets Group]
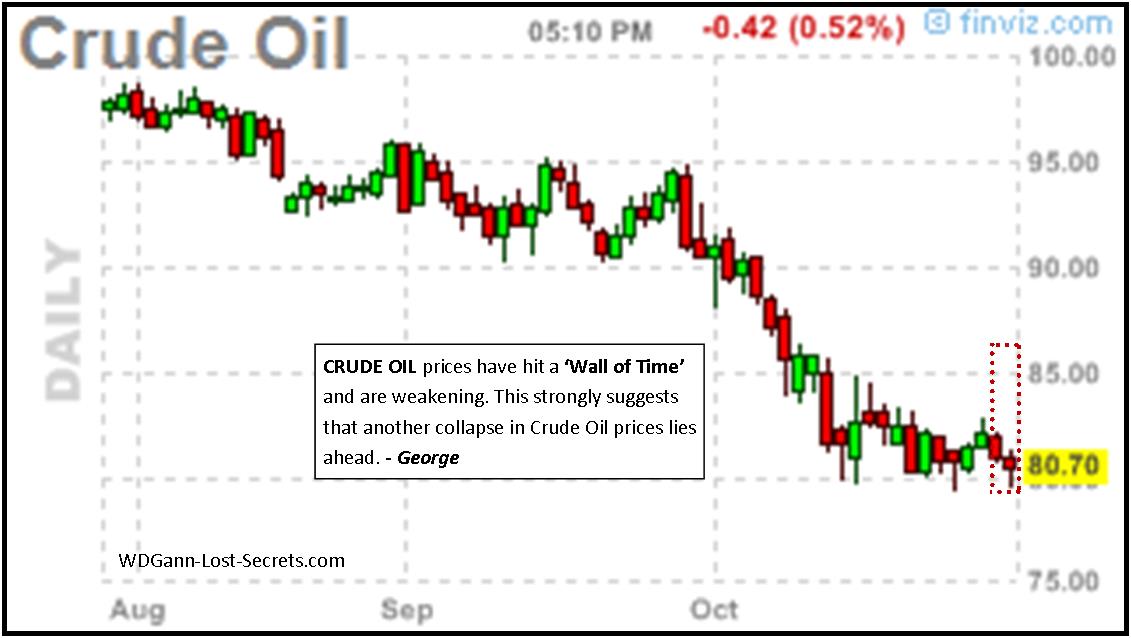
Chart courtesy of Finviz.com. All charts are for educational purposes only.
Prices can only verify a reversal to the upside by closing on a daily basis above $82.50.

Chart courtesy of Finviz.com. All charts are for educational purposes only.
Expect prices to drop dramatically again with $76.50 as a support price target initially should the low of 5-days ago be taken out.
– George [/private_WD Gann Trading Secrets Group]
Gold’s Predicted Move Now Valued at $6,800
GOLD CONTINUES IT’S SLIDE; VALUE OF MOVE HITS $6,800
The potential profitability of the predicted GOLD slide has continued to build up, at one point reaching $6,800 per contract in a two-day period.

Chart courtesy of Finviz.com Charts are for educational purposes only.
This illustrates the value of locating ‘loaded’ market opportunities, which requires special insights into each market.
Latest Gold Price Prediction Met
THE GOLD PRICE PREDICTION WAS MET FROM OUR PREVIOUS MEMBER’S PRIVATE POST
Our private members were able to see this chart a few days ago:
Chart courtesy of Finviz.com . Charts are displayed for educational purposes only. Read Disclaimer.
This was the predictive chart for the unknown future that only our private members had access to.
Let’s see what happened . . .
Chart courtesy of Finviz.co . Charts are displayed for educational purposes only. Read Disclaimer.
Gold prices dropped as predicted to the predicted price in the previous post which was a market move with a value of $2,800! – George
![]()
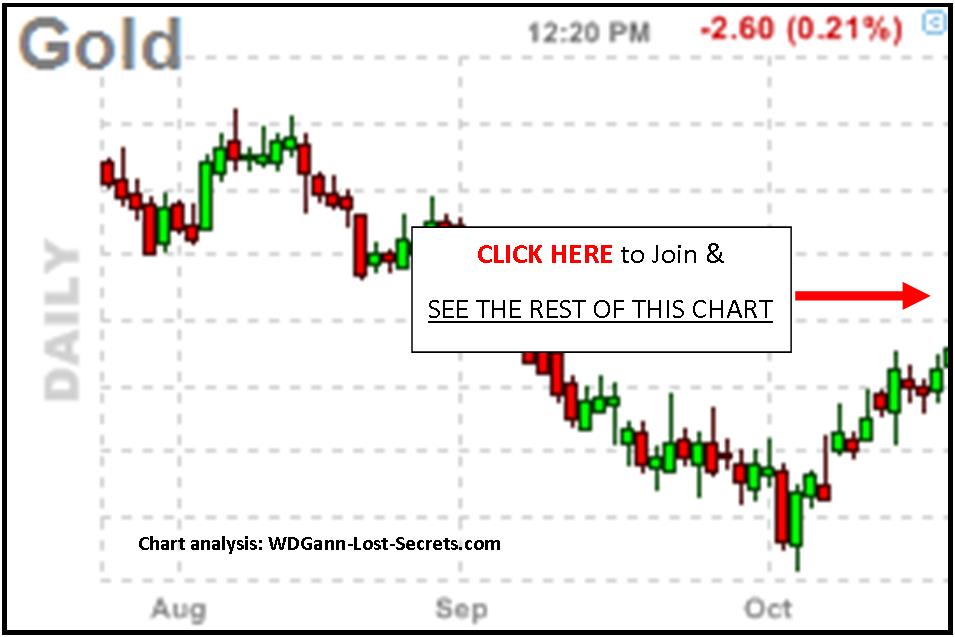
GOLD’S NEXT MOVE
GOLD’S NEXT MOVE:
When it comes to anticipating Gold’s next move, we need to acknowledge one of the fundamentals of trading: An answer to the question: “Just where are GOLD prices most likely to go next?” is valuable information.
This is especially so, when the techniques used have been proven over and over again over the last 4+ years to be highly accurate as to timing and price targets (as it has with this website and our sister site www.money-tigers.com).
What everyone wants to know is just to the right of where the chart below stops.
Now, nothing is really free in this Life and neither is this membership.
After all, it’s my hope that several of you will catch sight of the vision behind the techniques displayed in the Members Only area of this website and will want to learn those skills for yourselves.
Others may choose more in-depth analysis of the markets but, whatever it is that interests you or that you desire for your own trading goals, you will only get access to it as a private Member. So, you owe it to yourself to become a Member by joining today.
This information is intended for those mature and/or aspiring traders and investors that are willing to pay (in both expense & personal effort) to save decades of time, energy and expense in order to learn the fundamental, unchanging aspects of the markets and price movement.
Members will have access to gain that knowledge (or the results of applying that knowledge) NOW and not after 10, 20, or, yes, even 40 years of searching. And, that’s only if they’re ever found at all!
Many have spent years of their investment lives and most spent all of it searching without finding the hidden secrets of the markets. WD Gann left the vaguest of clues which could only be tied together with a ‘thread’ that lay outside his materials and, therefore, beyond the sight of virtually all seekers.
With your Free membership, you get just a ‘taste’ of what can be known in advance and all member information is presented purely as educational.
To plumb even greater depths of understanding and results, or, to have more timely studies and insights, you, as a member, will be presented with several additional options.
Yes, Membership is free, but, I do ask for something from you however. You must prove your sincerity of interest by putting forth the minimal effort of registering for membership. That simple action may lead to a life-changing course of action in your investment destiny.
The latest charts and calls are reserved for viewing by MEMBERS ONLY
You can still join the WD Gann Trading Group for FREE by clicking HERE or clicking on the chart above and registering.
[private_WD Gann Trading Secrets Group]
GOLD PRICES SIGNAL NEW DROP AHEAD
The GOLD market has signaled new price weakness that should manifest within the next few days at most.
The chart above shows with the orange circle where Time & Price have met and balanced out.
The next move should be strongly downward with some support at around $1205 and stronger support at around $1183.
If prices take out the lows, then $1140 should become the next target low to watch.
However, should strength come back into the Gold market prices would first have to penetrate and close above $1240 on the daily in order for Time & Price to re-establish themselves as a continuing uptrend. – George [/private_WD Gann Trading Secrets Group]
![]()
Stocks Approach Trend Shift Point
WATCHING STOCKS APPROACH TREND SHIFT POINT
Continued declines have pushed stocks close to a trend shift point as shown on the chart below:

Chart courtesy of Finviz.com. This chart is for educational purposes only and is not an advisory to buy or sell anything.
As October is historically a month of both declines and beginnings of bull markets I’d expect one of these two price lines to be a bottom.
The bull market that has been the stock market for the last year makes me choose the lowest price line (1640)as the one most likely to hold the bull market trend intact. If prices break below 1800 in the S&P 500, prices will have little to hold them back from 1640. – George
![]()
Predicted S&P 500 Support Price Reached
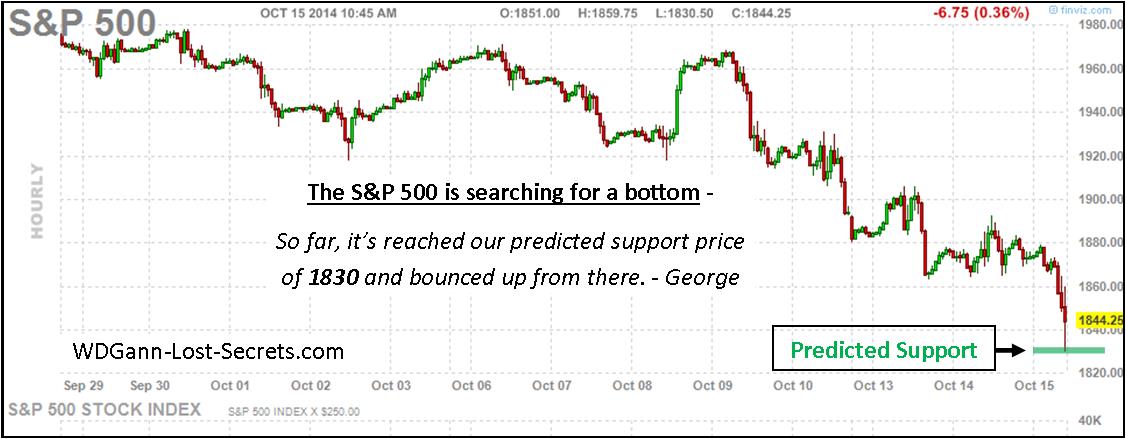
THE PREDICTED S&P 500 SUPPORT PRICE REACHED
The predicted S&P 500 support price was reached today.
Our initial support price was reached this morning and prices bounced upwards from there. This may not be the bottom yet, but, gives confidence that the market is following a predictable pattern. – George
![]()
October Market Slide
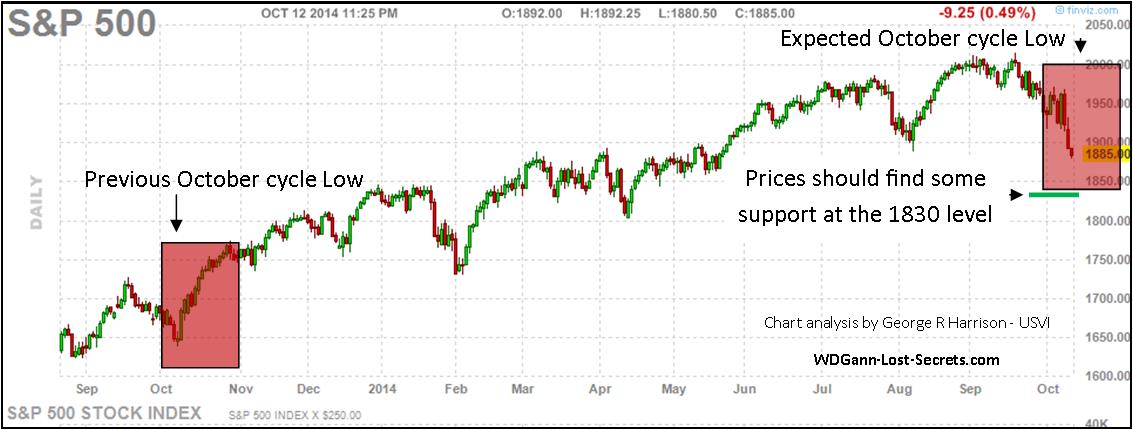
THE PRESENT OCTOBER MARKET SLIDE IS EXPECTED
There is an expected S&P 500 October market slide bottom that is acting out on cue at present. If you look at the S&P 500 chart below you’ll see a green horizontal line on the chart. This represents where we can expect to find some price support or slowing of the decline should it continue downwards.
You’ll note that this green price area is above a previous breakdown low which would mean that the public wouldn’t expect prices to stop there, making 1830 an ideal potential pivot point for price.
Click on chart for greater clarity ALL CHARTS ARE FOR EDUCATIONAL PURPOSES ONLY
This doesn’t mean that prices can’t go lower than this, but, time is running out for the expected bottom to occur. Should 1830 be broken through with downtrending prices, we’ll begin to accumulate the first of the confirming signs of slowing down of the bull market uptrend.
Taking out the 6-month lows would be an occasion for pause in our bullish outlook and warrant extra caution in expectations. This will happen someday, but, it hasn’t happened yet. Stay alert though. – George
Stock Market Lower Lows: An Emotional ‘Button Pusher’
STOCK MARKET LOWER LOWS. IS IT TIME TO PANIC?
It’s been another interesting week full of panic headlines. Stock market prices took up the panic cry and made lower lows on several indexes.
Both you and I know that, eventually, this soaring market will end it’s up-cycle and decline. When it does it will be indicated by lower prices; lower lows and lower highs. Here’s the question though: ‘Are the first lower lows enough of an indicator for us to take action?’
The definitive answer is ‘No’ and this answer is based on empirical facts which the historical S&P 500 chart below will show.
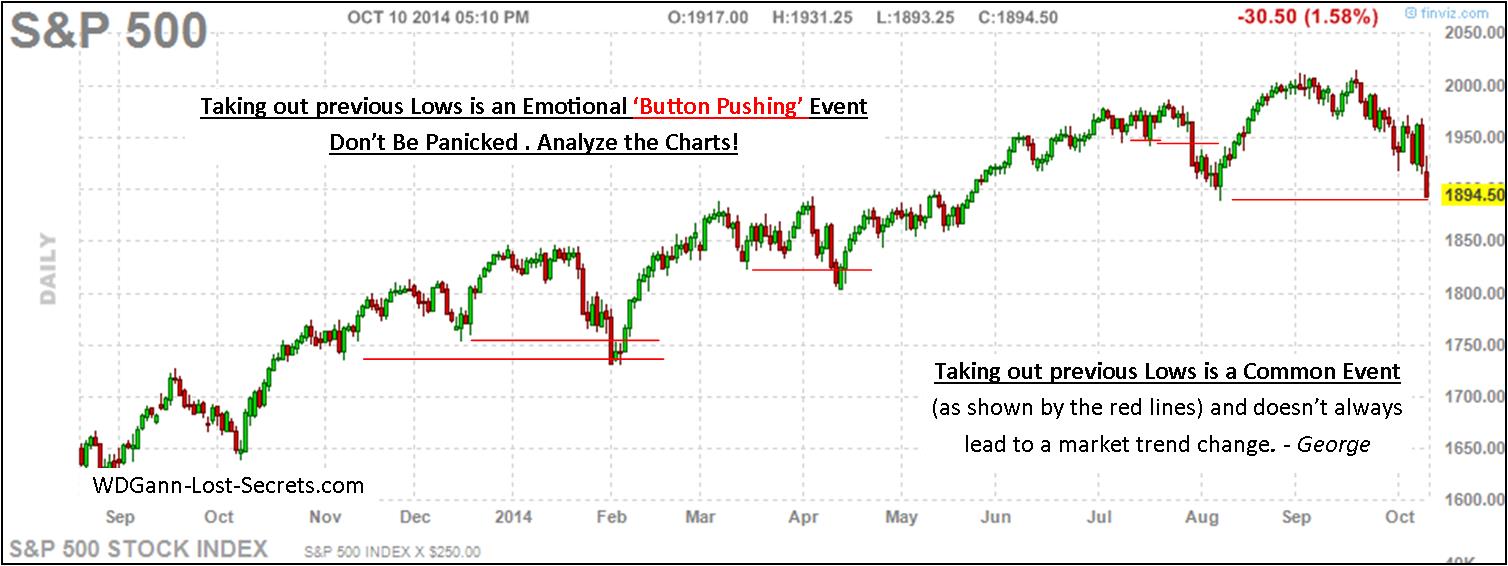
CLICK ON CHART FOR GREATER CLARITY
The red horizontal lines on the chart show all the times when lower lows were made over the last 12-months. On 5 (out of 5) occasions lower lows were made which led to, not a collapse, but, HIGHER HIGHS.
We’re now in the 6th occasion of lower lows, and, while any collapse in prices would have to make lower lows, I submit that we don’t have enough other confirmations to change from a super-bull uptrend to a down trend.
There’s a natural ‘respiration’ to markets just as in Human Beings taking a run. Sometimes, one has to ‘catch one’s breath’, recover a little and then press on with the run. It’s the same with the market. As we’ve seen previously 5 times now in the last year, there’s been a pause in the upwards ‘run’ followed by renewed strength and a new surge forward. A pause only rarely signifies quitting the ‘race’, and, there, would be other symptoms that would accompany such as dramatic shift.
We haven’t seen those other symptoms as yet and one is we haven’t taken out the last lower low point or taken out an Excalibur Method Trinary point. – George
WD Gann Secrets
MORE ARTICLES ABOUT WD GANN:

- New: Gann’s Trading Rules
- Seasons of the Markets
- WD Gann’s Key to Better Market Timing
- WD Gann Lost Secrets Rediscovered
- WD Gann’s Data List Secrets
- The Wisdom of Solomon & ‘The Solomon Clue’
- WD GANN: Going Beyond Astrology
- Proper understanding and placement of WD Gann’s critical price angles.
- Secrets to WD Gann’s greatest public trade (1909 September Wheat)
- WD Gann’s Law of Vibration
- Gann’s Lost Swing Chart Technique; WD Gann’s Data List Secrets
- Many more unique WD Gann Articles: HERE.
- WD Gann’s personal hidden chart key
- Gann’s secret counting sequence to predict monthly turns
- Rediscovering the secrets to Gann’s vertical & horizontal angles
The rediscovery of these WD Gann lost secrets (and many more) as well as other completely original discoveries are available to a limited number of students each year through The Harrison-Gann Trade Secrets Master Course. Contact me by e-mail for price and availability by clicking the box below.

![]()
Financial Headlines Lead Traders Astray
FINANCIAL HEADLINES EMBELLISH FACTS AND MISLEAD TRADERS
Today’s financial reading was much of the same foggy speculation, but, even so, I found it irresistible to point out one particular article’s lead headline (source mentioned on the chart) which went: “
“Silver Soars As The Dollar Dumps Most In A Year . . .”
This headline’s effect (on those less mindful than those of you who frequent this website) was to stampede traders to buy and sell the markets mentioned.
The operative emotional trigger keywords were ‘Silver Soars’ and ‘Dumps Most in a Year‘. Our approach on this website is to dispel BS using the pure reality of the price chart as our ‘magic glasses’ to see what’s really going on.
Let’s look at the Daily chart for Silver to crosscheck the ‘Silver Soars’ statement:

All charts are for educational use only. This is not an advisory to buy or sell.
As the chart above shows, this ‘Silver Soars’ headline is a NON-EVENT on a daily chart of silver prices. That lonely green bar is supposed to change our minds about the solid, months-long DOWNTREND?
I think not.
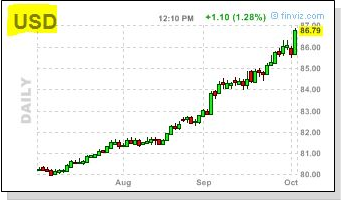
How about the US DOLLAR then?
So sad to hear that it “crashed by the most in over a year today.”
That sure sounds like a heck of a slide. It must be a massive red line on the chart then, yes?
NO!
Instead we look at a US DOLLAR chart and see this . . .

All charts are for educational use only. This is not an advisory to buy or sell.
Take a few moments to look at the dollar chart above, because, if you don’t take your time, you’ll probably miss the great ‘dollar crash’ they’re writing about!
Now, I know that the writer is referring to the percentage move, but, that’s not the implication of the headline as written. What was written ended up being extremely misleading and alarmist.
Obviously, when one goes and investigates for themselves just what the markets referred to are doing, the exaggeration of events in these headlines stands out and begs the question of ‘how can events be so mis-written?’
We can just call it poor writing due to inexperience. That’s the kindest assessment we can make. The other alternative is more likely but will go unwritten at this time.
Does someone want traders to Buy Silver and Sell the Dollar?
Those that followed such headline suggestions would find themselves on the opposite side of two very strong price trends leading to likely losses and profiting those trading with the stronger trends and taking the very opposite positions suggested for others.
The bottom-line for us as traders and investors is familiar; we must check all opinions heard or read against the reality of the price chart. In this case the ‘greater fool’ would be someone who jumped and reacted to these headlines.
Examine the charts and provide yourself with tools to better ‘foolproof’ oneself from speculative opinions. – George
![]()
 Take some time to examine some of the testimonials from purchasers of the Excalibur Method analysis technique.
This method and the advanced techniques included within the proprietary Harrison-Gann Trade Secrets Master Course are needed more than ever to locate and harvest the many opportunities that come with ‘interesting times’ of financial volatility.
I’m selling only a few more copies of the Excalibur Method before the end of this year and am accepting a few new students for the Master Course. E-mail me for details and availability if you wish to avail yourself of this hard-won market information. Thanks. George
![]()
FOREX: Strengths & Weaknesses
FOREX: FIRST DETERMINE THE BASICS OF WHAT’S STRONG & WHAT’S WEAK
Yes, there’s plenty of action in FOREX Markets trading intraday, but, to gain a solid feel about the major trend in the currencies, we really need to examine just two items.
As most of the popular currency pairs are defined in comparison to the US DOLLAR, the real test of strength or weakness comes down to just two questions:
- “How is the US DOLLAR doing?” and,
- “How are all the other currencies doing relative to the US DOLLAR?”
Answer just these two questions, and you’ll know which way the winds-of-change are blowing in the economic world. You don’t need to read essays, stockpile advanced degrees or have inside ‘hot’ tips to do this. In fact, we can use an entirely visual approach that will yield solid, profit-oriented information.
Let’s do it, starting with the two questions again, but, this time using visual only answers without emotionally-loaded words, symbols, descriptions or opinions:
- “How is the US DOLLAR doing?”
- Answer: (See chart below).
Now, for the second and last question:
- “How are all the other currencies doing relative to the US DOLLAR?”
- Answer:
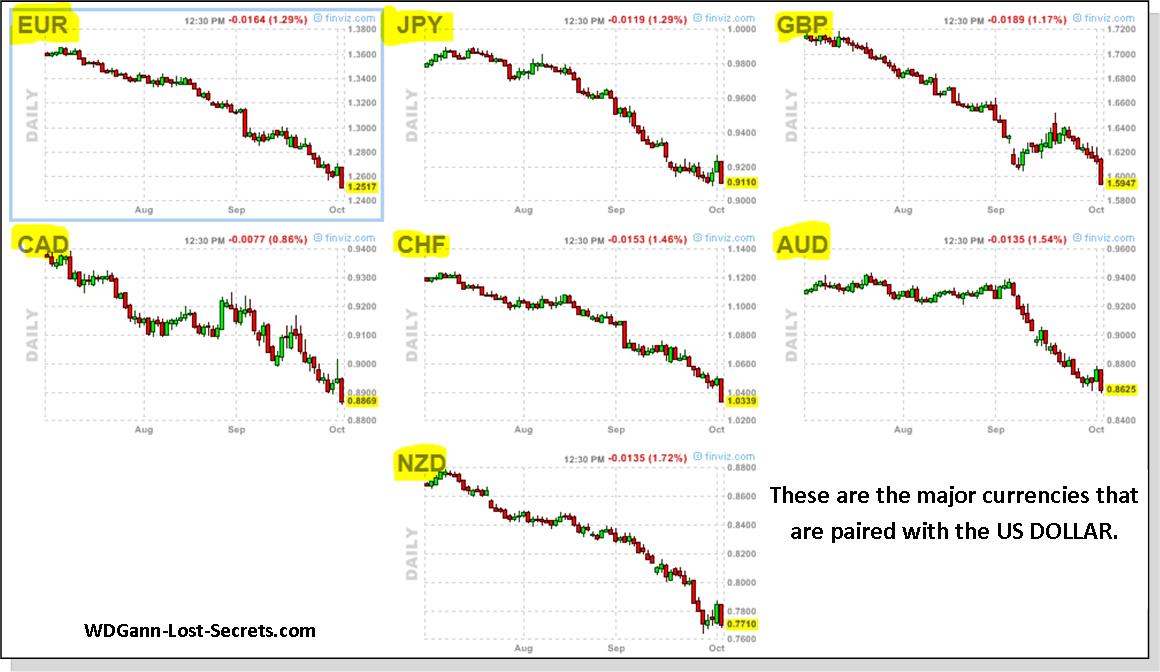
There you have it. Your own eyes have provided enough proof to enable you to bypass all the ‘news’ that talks up the case for Europe or the state of the economies of any of the nations behind these currencies.
The US DOLLAR is STRONG. It’s the king-of-the-mountain for currencies at present. This isn’t a political statement, just a statement based on the truth of the chart. A Long position in the US DOLLAR is the winning trend at present. In like manner, the facts are (as you can plainly confirm from the above charts) that the EUR, JPY, CHF, AUS, CAD, GBP and NZD are WEAK Currencies.
All of them. Short positions in these are the winning side for profitability at present. As WD Gann used to write, ‘test all things’. I’d add, test them for yourself instead of trusting others opinions. – George
![]()