Tag Archives for " WD Gann "

​Two More Strong Stock Markets . . .

​In my previous post and in my efforts to show how Deflation was acting globally, I overlooked several additional Markets that have displayed enviable strength this past year. Let's look at two of them now.

​​While most countries struggled through the last year only to come up with net losses, these two Stock Indexes made GAINS, Strong Gains: The​se are the Nikkei 225 Japanese Stock Market Index and the Russian MICEX Stock Index.

​The chart for the ​Nikkei 225 Stock Index is shown above. Healthy gains have been realized when looking at the long-term gains over several year's time.

The ​long-term (year-after-year) trend should be considered as any single year's returns won't be enough to break the longer-term trend.

The next Strong market of interest is one that's been made largely 'invisible' by the mainstream financial media (as it taints it's 'news' with a political slant that omits saying anything good about perceived competitors or 'enemies').​

​This is also an anti-competitive position as well, as, in the case of the Russian Stock Market Index (MICEX), they have a market that is vastly outperforming most of the World's Stock Markets at present. There's no Deflation evident in this Market as you can see in the chart below . . .

The above chart for the Russian Stock Market shows how ​well ​the Russian Economy is going despite what you read in the news or see on tv.

10% Gains truly stand out when compared with losses almost everywhere else this past year.

​Japan, along with the US make up a significant proportion of the world's GDP. Both Markets are Strong. This is Positive.

​Opportunities Abound. You Just Have To Be Able To Read The 'Signs'.

As entrepreneurs, investors and traders, we understand that opportunities for profit-taking shift locations from time-to-time, but, will always exist somewhere. Always! Here are two more markets which could have continued one's forward motion towards financial stability and accumulation. You need to be able to TIME the long-term position trades as well as the shorter-term ones. It's critical in order to keep losses and risks as low as possible.

​To reiterate, we need to pull our perspectives back to take in the abundant opportunities that exist elsewhere in the World, and then, act on the opportunities.

Also, To effectively do this, it's necessary for us to be equipped with the most Effective Trading Techniques and Knowledge to be able to detect just where those profit targets of opportunity are. ​

​To be able to sort the 'wheat from the chaff'.  This is the very best time of the Year to pick up those skills & knowledge.

Season's Greetings!!!

​THIS IS MY SPECIAL ANNUAL OFFER . . .

I'm very grateful for all of you, my faithful Clients and Students for this past year and all previous years of our association together.​

I extend my best wishes to you and yours during this Holiday Season and through-out the remainder of this year and the years to come.

To expand on those good wishes with solid actions to match, I'd like to offer ALL a special price on any Course or Method you've been interested in over the past year(s). I'd love to get these rare and special courses into your hands for this Holiday. E-mail me here. - I don't want anyone to be left out this Season. Contact me with your wish list. George

Contact me with your Trading Course WishList. George

The 2 Strongest Stock Markets . . .

To continue our examination of the prevailing deflationary environment that defines the markets today, we now turn to what's still 'working', i.e., what markets are the strongest in the group?

​For this answer, we have merely to consult our post from yesterday and find the chart of Equity & Bond Performance over the last year's time. We'll find only 2 Markets 'still standing' in a vast field of losers: The United States and Brazil.

​The chart for the US Stock Market (as represented by the Dow Jones Industrial Averages), is shown above.

The major uptrend that started back in the depths of 2009 is still in play. Although, we are in a weakened position at present, when looking at the Monthly chart for the market, we see clearly the uptrend is largely intact.

​This Market is still strong probably because of the economic reforms that have be instituted recently. Capitalism is still strong in the US, while the rest of the world is experiencing the inevitable bad harvests of socialism and burdensome regulations. This seems to be the common thread connecting two seemingly separate economies; that of the US and Brazil, where a new pro-capitalism president has taken office and where populism is also on the upswing.

The above chart for the Brazilian Stock Market shows how ​well Brazil has recovered from it's pull-back of the last few years. It's now well-positioned to launch even further ahead while everyone else's attentions are on other areas of the world and trade issues.

After all, since 2016, the Brazilian Bovespa has made gains of over 215%, this while most markets have accumulated Losses, not gains.

​Also, keep in mind the relative strengths of the different national economies. Globalism theories aside, there are really only two ​major drivers of the world's economies at present, the US and China. China, however, is in retreat at the moment as it deals with it's trade and banking issues.

When either of these two sneezes, the rest of the world is going to catch cold!

However, as entrepreneurs, investors and traders, we understand that opportunities for profit-taking shift locations from time-to-time, but, will always exist somewhere. Always!

We need to pull our perspectives back to take in the abundant opportunities that exist elsewhere in the World. ​

Also, To effectively do this it''s necessary for us to be equipped with the most effective trading techniques and Knowledge to be able to detect just where those profit targets of opportunity are. ​

​To be able to sort the 'wheat from the chaff'.  This is the very best time of the Year to pick up those skills & knowledge.

Season's Greetings!!!

​THIS IS MY SPECIAL ANNUAL OFFER . . .

I'm very grateful for all of you, my faithful Clients and Students for this past year and all previous years of our association together.​

I extend my best wishes to you and yours during this Holiday Season and through-out the remainder of this year and the years to come.

​T​o expand on those good wishes with solid actions to match, I'd like to offer ALL a special price on any Course or Method you've been interested in ​over the past year(s). I'd love to get these rare and special courses into your hands for this Holiday. E-mail me here. - George

Deflation Opportunities Ahead?

Have We Now Entered a Deflationary Era?

The signs have begun to reveal themselves slowly over the past months. And, recently the Stock Markets have joined in to indicate that we may well be entering a deflationary error. These aren't anything new, but, we haven't experienced a protracted period like this in quite some time.

The most famous of the last Century were the period following the 1929 Stock Market Crash period and the severe 1974 deep recession.

What are the clues to this scenario repeating? How about we look at the overall returns in, not just a few, but many markets world-wide over the last year to start. When we do, we find results like those shown on the graphic below . . .

The above graphic shows how International Stock & Bond Markets have performed, and, with the exception of just 3 nations, all have been in the loss column over the year past. This is a strong clue that we're dealing with a global slowdown and not a local one only. In fact, the US is the strongest market still of all the rest shown.

But, as we look a little deeper, we find further confirmation in the commodity and currency markets as well (see the chart below).

Above, we see at a quick glance, 47-Markets of all kinds including Currencies, Commodities and Stock Indexes.

A quick look at the amount of red on the bars shows that losses clearly dominate over gains.

As it turns out, 38 out of 47 markets showed losses (80%).

What does this insight do for us as traders and investors? Well, for the longer-term it means that these 'loss' markets are actually inclined to go down with the deflationary trend. That means they'll provide more profit opportunity on the Short side for trading going forward.

We'll examine this a little closer in upcoming posts.

Season's Greetings!!!

Special Offer . . .

This is the time of year that I'd like to express my gratitude to all our clients and students.

​The best way I know to do that is to offer ALL a special price on any Course or Method you've been interested in ​over the past year(s). I'd love to get these rare and special courses into your hands for this Holiday. E-mail me here. - George

Stocks & Emotions

The US Stock Market: This is another update on the Markets as this is in the economic 'news of the day' almost every day now for the last week or so.

​The S&P 500 Stock Index shown in the chart below), ​Nothing (as yet), has changed about this still being in  a huge BULL Market​! Granted, there's been some healthy pull-back in price as shown in the chart below.

In point of fact, the recent pull-back which has everyone in a panic and confused state, still hasn't even matched the pullback in prices that we saw last March. This same price pullback would have brought prices down to the price level shown to the green angle line on the above chart.

​However, we are getting close to an important pivot price point and, this bears watching and making a 'Plan B' once prices cross the green angle line shown on the above chart.

​This post is merely to update and calm nerves. We need to keep perspective and stay rational. If we let emotions anywhere near investment decisions, we come to regret it.

How does one stay rational? Use the 'dullness of History', to calm ourselves down.

Nothing compares to 'history' or, in our case, historical charts to bring this about, Old, historical charts of similar market conditions will show us how people, as a group, acted in the past. This will bring both a sense of perspective and the emotionlessness of understanding that people today won't act much differently than they did in the past.

This should bring us a sense of Calm, as, People haven't changed and will repeat again what they've done before as a group. This is applying Perspective and Understanding that can guide our way into the days and weeks ahead.

Can we have another Global Finacial Panic as we did in 2008? ​

Sure, and the fundamentals are in many ways even worse today than they were back then. However, our focus & philosophy (adopted Mr. Gann's own writings) on this website is to 'track' the market charts and let them 'do the talking' and not outside 'authorities' (who may have ulterior motives for their 'news').​

And, what does the chart 'say'?​

​It says: 'Caution', not Panic. Timing is everything here and, acting too premature to the truth of the charts can be dangerous. Patience is our greatest tool at points in time like this. ​​ - George

The True State of the US Stock Market

The US Stock Market: Far from the hysterical screams of the perpetual Market Bears (who spend each day awaiting the Final Crash that will end all civilization), we find those rational few who can distinguish 'the forest from the trees'; those who can discern what's 'Real' from what's fantasy and market manipulation.

​When it comes to the US Stock Market (as seen in the S&P 500 Stock Index shown in the chart below), one needs to discount almost everything being written or presented in television market media. The Truth about this huge BULL Market is that it has finally taken a long-overdue pause from it's relentless climb in order to consolidate and prepare to continue it's bullish behavior!

In point of fact, the recent pull-back which has everyone in a panic and confused state, hasn't even matched the minor pullback in prices that we saw last March. This same price pullback would have brought prices down to the price level shown by the red horizontal line on the above chart.

Until this first threshold is reached on the downside, then, any talk of a major market downturn is premature and, just plain misinformed.

The green uptrend angles still indicate the overall direction of the market once price has consolidated and re-grouped. This could take a few more weeks to complete, but, overall, one should expect that which is historically sound and not an out-lying event to occur (when hearing hoofbeats, expect horses not zebras). ​

Far too many people are expecting a big crash and are trading short than should be expected to be correct. The Markets just don't work that way.

The odds on the mass of traders being correct at such a critical market turn of the Greatest Bulll Market of all Time are astronomically AGAINST, and not for this event to occur.The real downswing, when it occurs, will catch almost everyone by surprise as most can be expected to be manically optimistic to the upside potential​at at the exact moment that the Market Breaks for real. The General Public will most certainly get this WRONG. Someday will come, assuredly, however, real market capitulation isn't indicated at this time though. - George

Brent Crude Daily Signal & Trend:

The ​current daily up-trend from August is still intact, but, is a bit on the over-sold side with a short-term pull-back expected this week. Watch the yellow trend line. - George

The Holistic Universe of W.D. Gann – Part III

How to Understand WD Gann’s Work

Viewing WD Gann’s work through the lens of his Natural World View opens a fresh doorway of understanding and perception.

It provides a ‘World View’ to help better understand and interpret WD Gann’s work. Evidence from quantum physics proves that without question that we’re living within a holographic inter-connected Universe and Astrology was an ancient tool which represented this natural connection in earlier civilizations.

Astrology wasn’t so much a predictive tool as a map of the energies associated with certain areas of the sky. These otherwise invisible sky areas could be pinpointed using our local planets, Sun and Moon as pointers and record keepers of events associated with those geometric sky points. These indicated points of charge & discharge which, in turn, were reflected or became causal factors in Earth-based ‘Events’ of noticeable or historical importance.

Therefore, this viewpoint of what we refer to as ‘Nature’ was nothing more than the ‘Science’ of another, more holistic culture.

Thought of in this way, it’s plain to see that Astrology was really a more holistic and sophisticated version of our modern clock. Our modern clocks just show us the hours of the Earth’s ‘Day’, while, the Astrological ‘Clock’ has several more ‘hands’ (one for each Planet including the Sun & the Moon) to it indicating the state of the entire Solar System.

This more ancient perception provides a new dimension of perspective as different as that shown between a microscope and a telescope. Both use lenses but the scope of their perceptions reveal two entirely different worlds.

HolographicUniverse

WD Gann’s world was one of Price, Time, Volume, Astrology, Mathematics, History and Geometry. In Gann’s world these all were connected with threads mostly defined by Mathematics and Geometry.

Astrology was included only in the sense that the placements of planetary objects were just another view of the world we live in and, therefore, had connections that weren’t so much magnetic or even electrical in nature, but, primarily Mathematical and Time related.

One of WD Gann’s number wheels is shown on this page and symbolizes the wholeness of the Circle which represents a complete Cycle. Geometry is the underlying reality of this World View and is also indicated by different shapes shown within the circle.

Mr. Gann developed many of his techniques using this ancient perspective and, I believe that this same alternate view of Nature will aid you in your WD Gann studies as well. – George

© 2013-2018 George R. Harrison, Christiansted, VI

The Holistic Universe of W.D. Gann – Part II

W.D. GANN: Man, Measurement & Markets

584px-Ptolemy_Astrology_1564Humanity’s present model of the Universe is one that separates Man from Nature by breaking Nature down into smaller and smaller components while searching to strip Truth from each piece separately.

In this process the inter-connectedness of one part with all others is lost beneath a microscope only focused on the single object and, thereby, the Soul; the complete Wholeness of the ‘examined’ is lost to view.

This divisive process started back in the 1500′s and has only accelerated in the last 100-years. This, in spite of the findings of quantum physics that confirms the ancient model of a participatory Universe.

Science has come full turn to rediscover the truth again at last: It seems that all things in our Universe ARE connected after all.

The holistic & holographic realm of the ‘enchanted’ is a World of Connectedness. One where both we and the Universe play active and responsive roles to each other.

This is a place where Time and Measurement act as connecting threads to events seemingly separated by great spans of historical dates yet, are, in truth, causally related.

This realm no longer requires ‘belief’ on one’s part. It’s now a scientifically proven part of quantum physics.

This Natural World View from the Beginning up to Ancient Times incorporated within it the ‘connectedness’ of all Beings AND Things (including Mathematics and Geometry) and treated them all as a living Whole.

Next Part: HOW KNOWING GANN’S WORLD VIEW HELPS US TO UNDERSTAND HIS METHODS.

NIFTY 50 Intra-day Signals:

The ​Intra-day possibilities for the Indian NIFTY 50 Stock Index are presented here today so that we can examine and note that, no matter what market, no matter what country; the same Market Truths prevail. ​Even when most Traders can't see them!

​Applying the 'Fibonacci Trends' Trading Technique to the NIFTY 50 Stock Index, (even on an intra-day basis) reveals ​many potential Entry & Exit points to both Long and Short Trades. To view these points better, you can simply roll your mouse over and, CLICK ON CHART TO ENLARGE

​Our Trading Course Library can help you to locate these important turning points on both long-term and intra-day time frames​Our recent focus has been on our amazing 'Fibonacci Trends' Method, but, we have many other excellent choices - George

The Holistic Universe of W.D. Gann – Part I

The Holistic Universe of W. D. Gann | Part I |

By George R. Harrison©2013-2018

“The quickest way for you to learn how to determine future market movements is to study the past.” – W.D. Gann

WD Gann’s Holistic Approach to Markets and Trading:

The deeper one delves into WD Gann’s work, the more one will be confronted by a strange and unfamiliar paradigm. It’s become clearer to me (over the decades) that WD Gann’s work should be referenced to an entirely different, HOLISTIC and Ancient World View rather than to the very narrow one we possess today.

This ancient perspective on Nature and Man’s place within it predates the earliest histories. It also, clearly, is far removed from today’s ‘Scientific/Logical’ approach to defining our World.

It seems completely foreign to us today because this ancient framework of Thought and Perception has been effectively pushed out of Society’s Collective Consciousness by the Scientific or Copernican Revolution.

Knowledge of this particular World View of Mr. Gann’s gives us an important tool and perspective for better understanding WD Gann’s COMPLETE works (they should be considered as a WHOLE and connected) as opposed to focusing on only the fragmentary pieces of Course materials he left behind as complete in and of themselves. To Understand Gann’s Quest, we need to ‘connect the dots’ to see the larger picture of Reality that he discovered and, upon which his work was based.

In ‘Part 2’, we’ll take a look at the present model of the Universe vs. WD Gann’s view of the same . . .

EUR/USD: Long-term Entry & Exit Points . . .

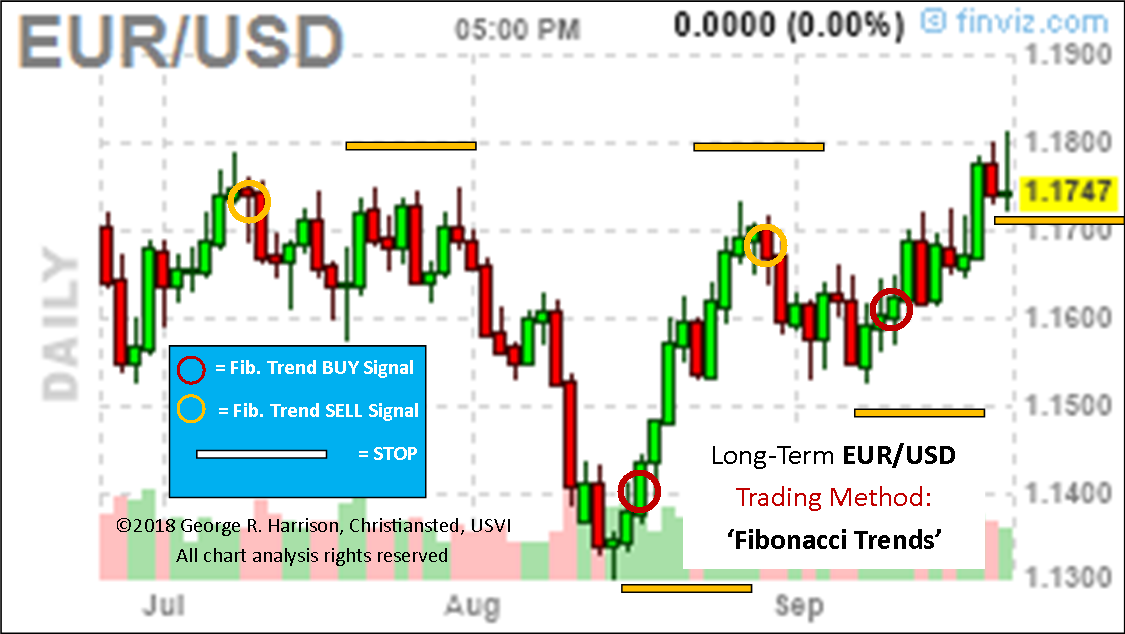
The ​EUR/USD Forex Market pair has been locked in a sideways, long-term non-trend for several months now. ​Even so, 'Fibonacci Trends' has been able to discern significant, profit possibilities during this time.

​Applying the 'Fibonacci Trends' Trading Technique to the EUR/USD on a longer-term basis reveals four entry points for new trades/exits, four-Stop points which HELD and the current Exit to the present Long trade put on in early September. To view these points better, you can simply roll your mouse over and, CLICK ON CHART TO ENLARGE

​Our Trading Course Library can help you to locate these important turning points on both long-term and intra-day time frames​Our recent focus has been on our amazing 'Fibonacci Trends' Method, but, we have many other excellent choices - George