
A Great Investment Year Ahead!

In these closing days of 2014, I’d like to thank you all, (Clients, Students and readers alike), for an exciting year of discovery, teaching and market predictions.
The Holidays are a useful time to reassess the year past and place emphasis on the positive events and how they have brought us to today. The Year 2014 offered lots of positive market surprises. Positive, that is, for those who saw them coming and made plans to accommodate the change.
We can look forward to even greater potential for change going forward into 2015.
There are some really strong trends that are approaching or are reversing this coming year. Change is afoot and change is where the greatest opportunities for rapid appreciation of profit occurs.
The title of this article: ‘A GREAT YEAR AHEAD!’ needs a little explanation, lest it be misunderstood. Let’s define a ‘Good’ Year as one that an investor can survive and prosper through.
A ‘Great’ Year then, we’ll define is one in which we not only survive and prosper, but one in which we profit so greatly as to offset YEARS even DECADES of previous results. That would truly be a Great investing Year would it not?!
We’ll only be able to do this by following the tide of History and the Markets.
Anticipation of upcoming great events based on sound mathematical rules, places one at the ready for those events and in the best position to profit from them. These are the tried and true rules of good business.
Cycles of War Create Cycles of Prosperity
Among the fortunate discoveries uncovered during our continued WD Gann, independent research work and, associated with the Law of Vibration has been finding uncanny years and decades of repeating events that lie far beyond the markets alone.
The Cycles of War and Prosperity are just two of these arenas. Though talk of war is unseemly at this time of the year, even Mr. Gann called attention to the fact that these very war periods brought about rising commodity prices and were strong drivers of markets.
Indications are that we’re in the early lead-up years to such a time again and moving towards that period (in 2019-2020) that will be very vulnerable to pressures for a new war period.
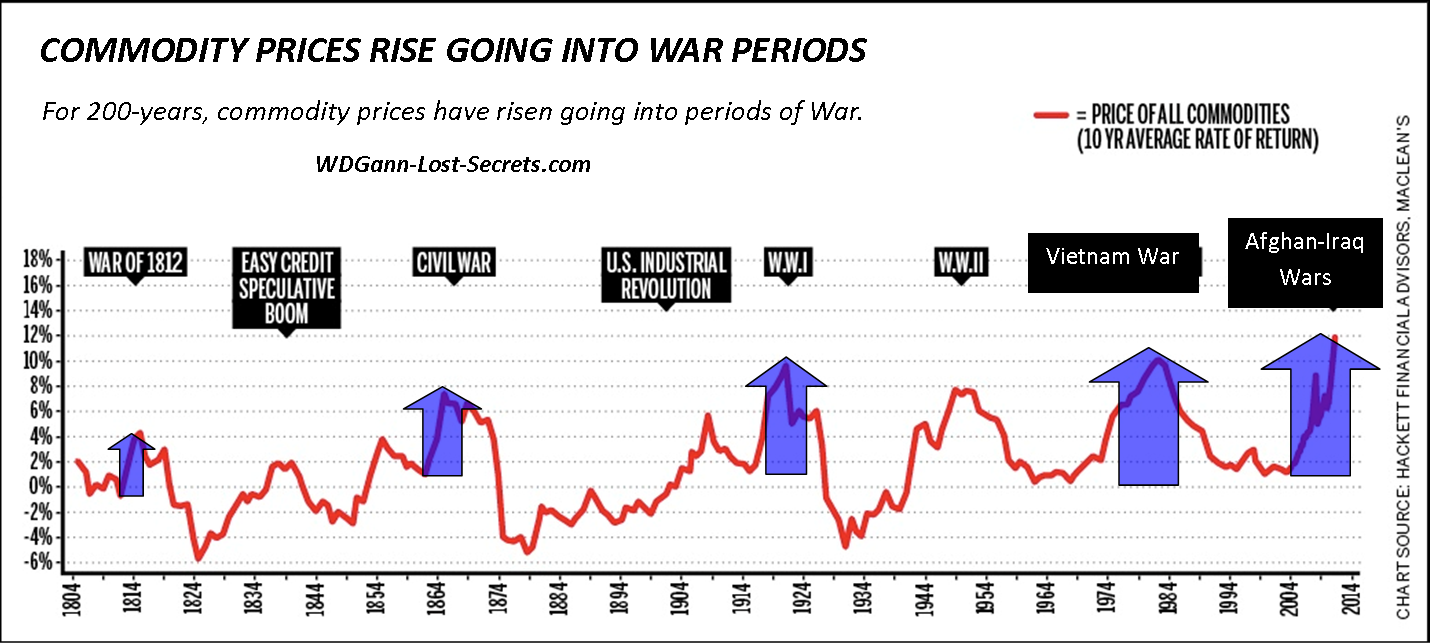
As can be seen on the 200-year commodity chart above, this cycle is almost constant in it’s application.
In short, it’s a ‘Rule’ you can largely depend on and a confirmation tool for the times we’re in. Although the chart above doesn’t cover our 2014 period, we’ve continued the price trend downwards from their peak in 2011. Therefore, despite the headlines, downtrending commodity prices indicate that there’s low risk of a major war at this time.
When prices start flirting with breaking out of this downtrend or prices begin a new rising trend, that would be an important sign that the rumblings of war are starting to reach a significant worldwide level.These ‘rumblings’ are too low to be heard by the common man but not too low to affect prices which reflect the change in demand by the parties planning wars. This is a bit early (about 4-years early by my count), but, something we should stay on the lookout for during this next year.
Once we’re aware of the ‘Times’ we’re in, and, we finally come to accept that Mankind hasn’t changed it’s behaviors or responses in the last several hundred (or thousands of ) years, then, we can prepare for the inevitable and home in on the details using simple historical checklists to confirm the trends under way.
Ultimately, We All Want Security
As businessmen and women, we can’t afford to get caught up in the emotions of events. We must deal with the reality of events.
That being the case, we seek out our security by finding the profit within the reality of events or markets.
Whether a market is going up or down, we, as investors, are in the unique position of being able to profit from both up and down price movement events! However, to fully take advantage of this opportunity, we can’t afford to assign an ethical or emotional context to what is clearly a historical (and mathematical) event. In other words, ‘what’ the market is which we’re trading (or the news or unpopularity behind it) should not be our main concern. Rather, ‘how’ a market is behaving within the boundaries of it’s unique structure and cycles should be our focus.
Let History Be Our Guide
Analysis is required to give us the context of a market’s actions and History can also guide us in the broad sense.
If, for example, our premise and analysis indicates that a major world war period is coming, then, we should also look at the surrounding economic and political environment for supporting signs that would accompany such an event as we move towards it in Time.
What should we look for as confirming signs?
Commodities should start working their prices upwards from strong declines going towards and during war years.Watch for this.
Politics: History shows that Worldwide political chaos comes on stage with new shifts in power bases dominating the pre-war scene. Reading the headlines today will certainly confirm that this is present today: CHECK.
The Economy: International economies tend to be in flux with money seeking safety in the world reserve currency of the time: CHECK.
The PEOPLE: During these periods the masses get restless and lawless. War is a great distraction to quiet threats to the political ‘status quo’. Political parties act only to save themselves and not the people whom they claim to represent. CHECK.
Well, you get the drift here. There are already a few confirming elements (3 out of 4 in the above list) to our future war premise and, those confirmations which revolve around the markets (changing of long-term trends) offer special profit opportunities especially during these very times when others will be confused, distracted or frozen in fear.
Remember, we don’t have to ‘like’ the events that are coming, but, they’re coming anyways.
We just have to be able to take advantage of the reality that this is how it is. There are mathematical cyclical and karmic reasons for repeating these tedious periods so, we can’t stop the karmic judgments of entire nations single-handedly nor should we attempt to for our own good.Rather, we need to become aware of the flow of events and where they’re headed. Then, place ourselves in the appropriate and best rewarding position as events unfold as they inevitably must.
Success in the markets lies in the Knowledge of Times & Trends as well as knowing the ‘signs of the times’ that we’re in. Count on the fact that knowledge drives out fear. Without fear to restrain & confuse us, there are no limits to opportunities to take advantage of except those limits we set for ourselves.
Get ready for a truly Great Investment Year! – George.
Crude Oil Price Objectives

Where is Crude Oil Heading?
Clearly, the lion’s share of the profit from this down move has been given out already. While prices have been dropping over $10/barrel each month.
Now that we’re down into the $55 dollar range, this rate of decrease can only have less than 4-months remaining before we reached the extreme lows of $10/ barrel reached at the lows of the last crude oil cycle.
And, furthermore, if we project outwards just one more month of $10 declines we’d reach the price of zero; free oil. An event that can be written off as impossible with high reliability.

What does this tell us then?
Well, markets at their extremes seldom move linearly so, the the 4-month timeline is unlikely, but, interestingly, that time period would take us past the high demand Winter Season and into Spring with lower-demands nearer their expected time for low prices.
The recent rapid rate of decline is likely to slow within this $50 region and, even rebound some from these lows to gather strength for the next down leg. This will extend out the 4-month rate of decline scenario and allow for a more gradual decline taking more time to reach ultimate lows. – George
The Excalibur Method of Market Analysis is offered ONLY from this webpage source.
Please contact George HERE for price and availability.
As noted in the previous post, there will be a price increase for all courses (including the Excalibur Method) on January 1st.
![]()
Show Me the Money-(flow)!
SHOW ME THE MONEY (Flow)!
By George R. Harrison
TRACKING MONEY-FLOW THROUGH VALUE SHIFTS IN MARKETS
We’ve all heard of the old magicians trick of distracting with one hand while the other is where the real set-up is taking place.
It seems we’re up against the same process at work in the markets we’re experiencing today.
There’s a fundamental and major shift taking place. Everyone feels the ‘vibe’ of it, but, where’s the proof (instead of the speculation) to bear out the truth of it?
It’s not to be found from conventional sources, that much is clear.
Like trying to detect the secrets of the magician, we need to focus on what the ‘other hand’ is up to.
When it comes to markets, a one-dimensional approach isn’t enough to reveal the whole multidimensional story.
Charts for stocks or commodities tend to be one-dimensional in that they’re generally denominated in that market’s national currency and this very fact can disguise the effects of that market relative to the international flow of money.
In other words, the question that needs answering is: ‘Is the international, ‘smart’ money flowing towards the market in question or away from it back into the world reserve currency (the US DOLLAR)?‘
Take the Bombay Stock Exchange index (BSE) for example in the chart below . . .

A quick one-dimensional look shows a strong bull market rise with, what looks like a normal downside reaction taking place within the trend.
However, to gauge a foreign market’s international VALUE, it needs to be compared with the world reserve currency, which, at this time, is the US DOLLAR.
A shift in a market’s value relative to the US Dollar, will reveal where the international flow of money from that market is headed. This will, in turn, reveal underlying strengths or weaknesses that may not be immediately obvious in the local currency denominated chart for that market.
When we compare the BSE to the US Dollar and chart that, we see something more revealing:

What shows as ‘weakness’ on this chart (the recent pull-back in prices) is now revealed to be something more serious as the money flow is shifting towards the US Dollar internationally and away from the BSE.
This is a powerful perspective shift that can alert traders and investors to fundamental shifts in markets which can only be seen relative to the reserve currency of the US Dollar.
By the way, this shift towards the US Dollar during the recent economic jitters is understandable and, it does affect the markets.
The US Dollar has soared in value to an exponential rate that will be unsustainable by it’s very nature.
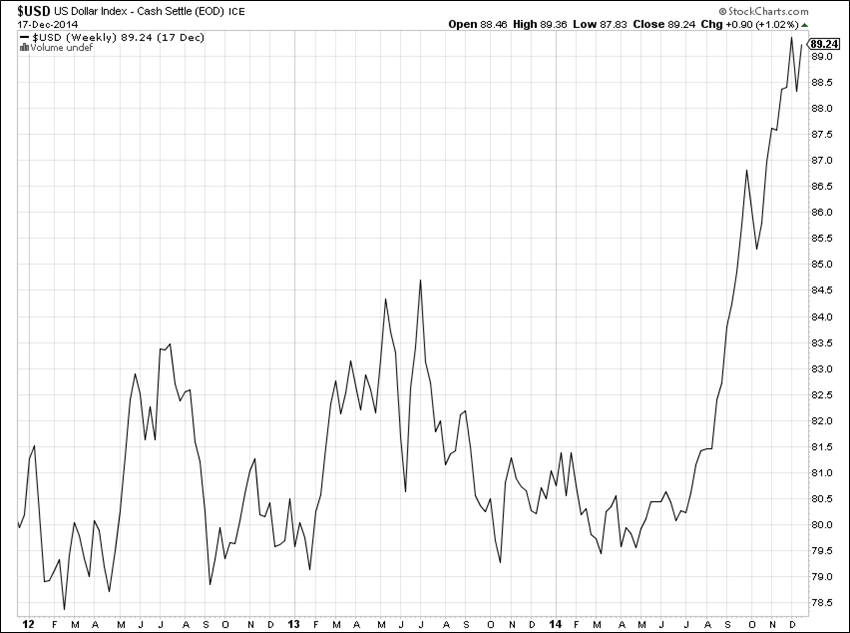
This flow of purchasing dollars is being driven by worldwide factors that have created instability or at least the perception of instability.
The smart money moves, and is moving, to the most secure or perceived secure locations.
By way of example, note how the German Stock Market (DAX) is reflecting the same world-wide trend:
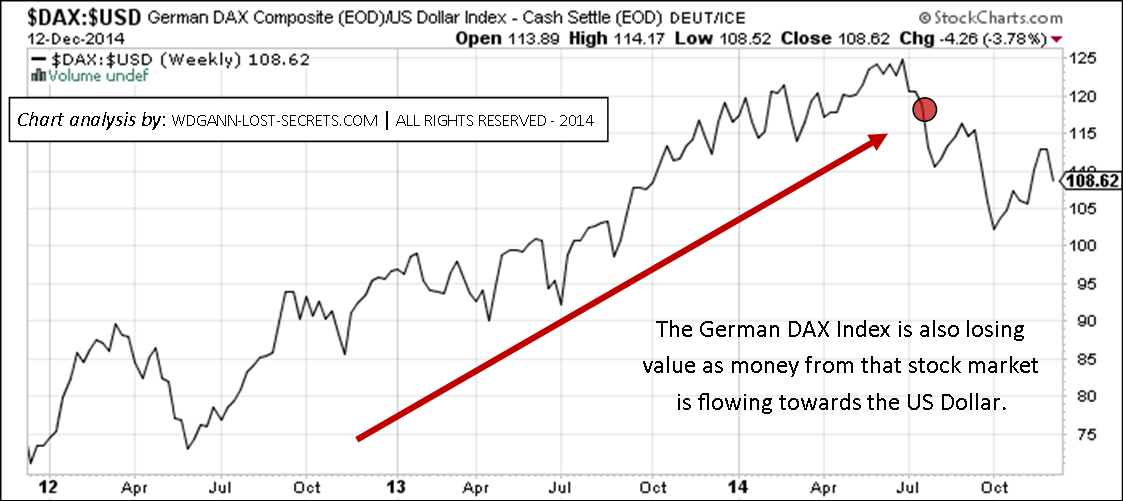
The shift for this market started back in July and never looked back.
On the other side of the World, as represented by Australia, we see the same loss of value and shift towards the US Dollar from the All Ordinaries Index:
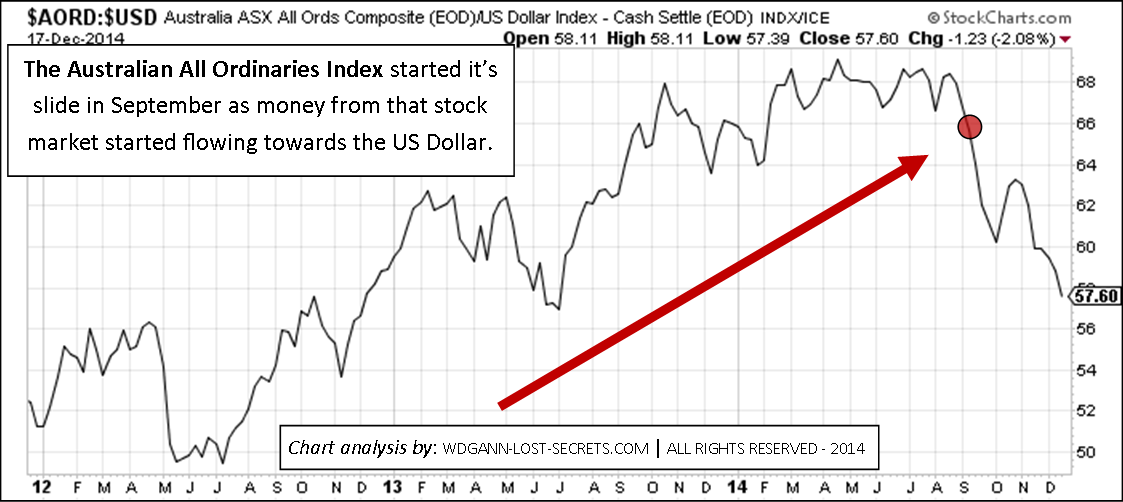
Clearly, significant sums are migrating from different nation’s stock markets and buying US Dollars for investment in dollar-denominated products.
This significant trend will have a monetary-system wide effect that will be hard to explain using the usual one-dimensional chart analysis.
The US DOLLAR is a powerful factor at work behind the scenes and one which we’ll examine further in the days ahead. – George
© 2014 Copyright George R Harrison – All Rights Reserved
george@money-tigers.com
Disclaimer: All articles and posts are a matter of opinion (drawn from over 44-years of market research & experience) and are provided for general information purposes only and are not intended as investment advice. Information and analysis above are derived from sources and utilize privately discovered methods believed to be reliable, but we cannot accept responsibility for any losses you may incur as a result of this analysis. Individuals should consult with their personal financial advisers.
From the website: http://www.WDGann-Lost-Secrets.com
—————————————————————————————-
Bio: George R. Harrison’s background includes time as a Hedge Fund assistant manager; an intensely focused 44-year long period as a researcher of the Markets, a Master Market Analyst & Chartist; recognized by Gann-trained clients from around the world as a uniquely qualified, modern-day WD Gann expert, (having rediscovered and restored-to-print many ‘lost’ Gann techniques through his decades of research work) and creator of several revolutionary market analytical techniques and tools.
Mr. Harrison continues his market research & private client consultation and instructional work while living on the island of St. Croix in the US Virgin Islands.
SPECIAL: Mr. Harrison now offers limited, private one-on-one advanced instruction in a resort setting on St. Croix in the Virgin Islands.
George may be contacted by e-mail at: george@money-tigers.com
![]()
Asia: Sand in the Gears of the Bull Market
Asian Markets:
Sand in the Gears of the Bull Market
By: George R. Harrison
The Asian Stock Market scene has been dynamic and strong. At least until some sand got into the gear works a few months back and started to grind the bull markets to a halt.
The ‘canary in the coal mine’ was first spotted in the Malaysian Stock Index.

Malaysia’s stock market has been the weakest of the 4 we’re looking at here and, as the chart shows, has fallen around 7% in the last 3-month’s time.
The Malaysian Stock Index decline also made it’s appearance known in both the Hong Kong and the Singapore Stock Indexes . . .
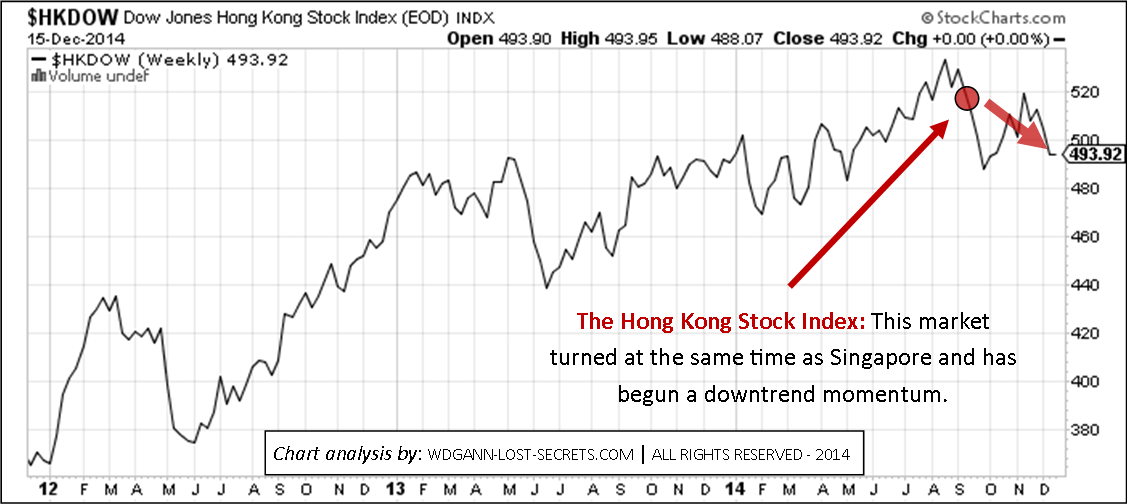
Near mid-September, the train ride upwards became derailed, hesitating and then started working it’s way further on the downtrending slope.
Singapore, the financial capital of the region, reacted and mirrored the shift at the very same time.
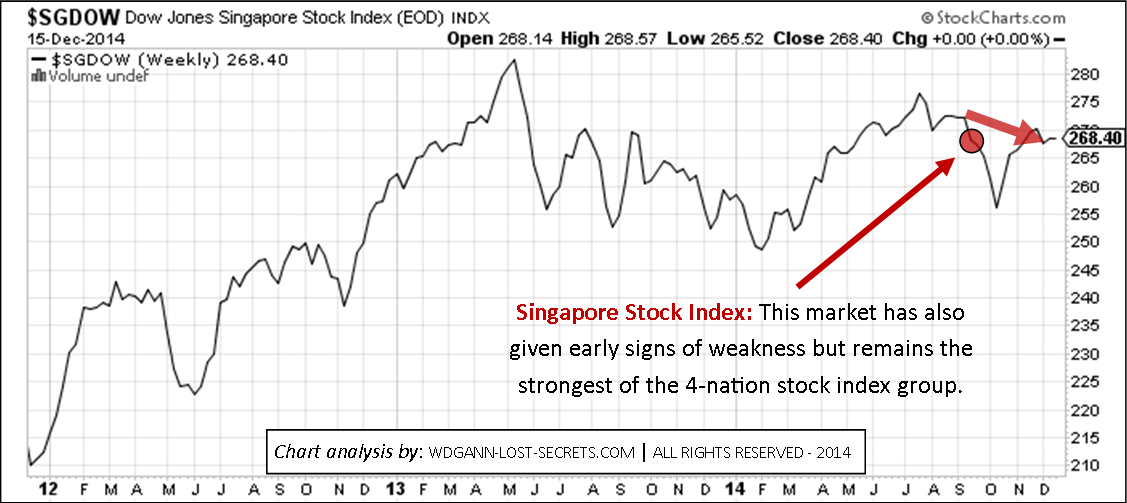
The main difference between Hong Kong and Singapore Stock Indices is that Singapore has weathered the shift much better, showing itself to be the stronger market of the two during this time period.
Of course both of these markets are huge compared to Malaysia.
No doubt that the continuing massive movement of funds to Singapore (leaving nations perceived as less safe and secure) has gone a long way towards keeping the index stronger, even after it’s initial falter.
However, all is not well in the region and there are plenty of ‘signs’ that indicate that a slowdown and trend change are in progress.
Besides Indonesia, (which has defied expectations by continuing it’s rocket ride upwards in spite of oil’s crashing prices) Thailand has been a shining light reminder of the good old days of uncomplicated bull market price movements.
It has enjoyed a beautiful, strong upwards, non-volatile bull market move all this year (until recently).
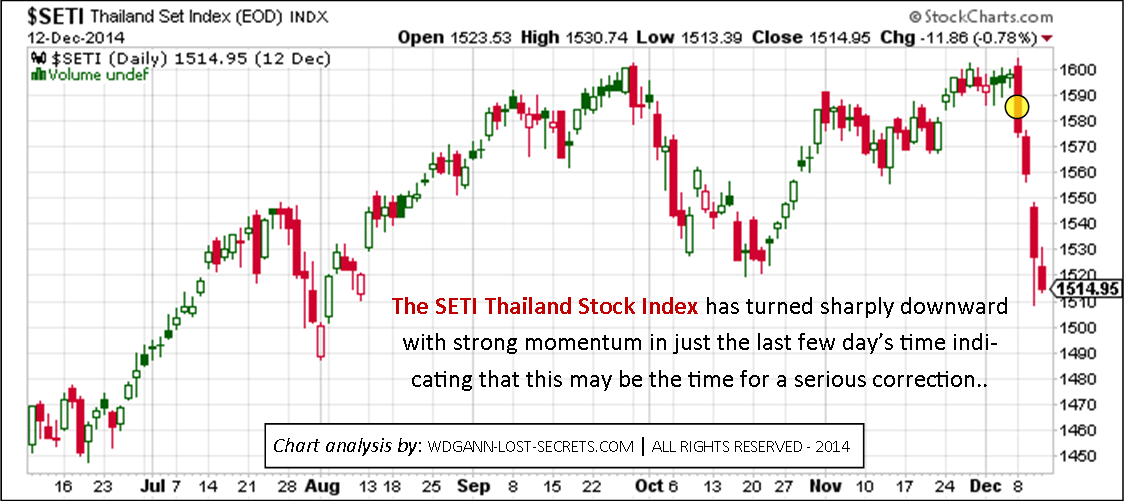
Alas, that sand-in-the-gearworks I wrote of earlier has begun to make itself visible in the Thai market now. When you look at the chart, you can almost hear the grinding and slowing down of the ‘gears’ to this index. If you listen closely enough, you may find that they have stopped and are starting to reverse a little.
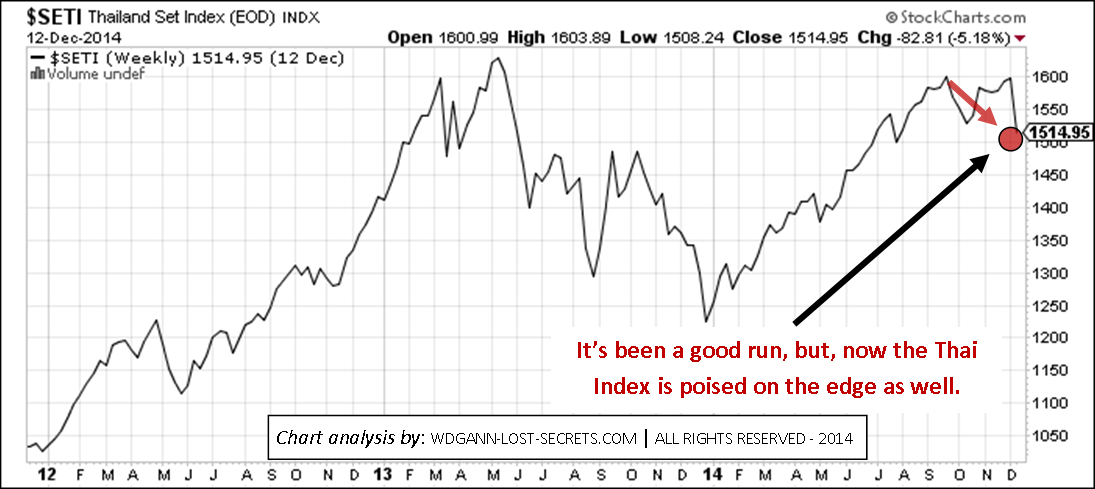
The Thai stock index has also been strong and managed to hold off the beginnings of faltering for an additional quarter past when the initial shifts were beginning to show in Hong Kong, Malaysia and Singapore.
However, it may be time for this market to ‘catch up’ and the last few days seem to indicate that that’s what’s happening.
Behind all of these market gyrations is the effect of the US DOLLAR and the weakening of so many currencies against it. We’ll examine this more closely in the next article as space is limited here. – George
© 2014 Copyright George R Harrison – All Rights Reserved
george@money-tigers.com
Disclaimer: All articles and posts are a matter of opinion (drawn from over 44-years of market research & experience) and are provided for general information purposes only and are not intended as investment advice. Information and analysis above are derived from sources and utilize privately discovered methods believed to be reliable, but we cannot accept responsibility for any losses you may incur as a result of this analysis. Individuals should consult with their personal financial advisers.
—————————————————————————————-
Bio: George R. Harrison’s background includes time as a Hedge Fund assistant manager; an intensely focused 44-year long period as a researcher of the Markets, a Master Market Analyst & Chartist.
George has been recognized by Gann-trained clients from around the world as a uniquely qualified, modern-day WD Gann expert, (having rediscovered and restored-to-print many ‘lost’ Gann techniques through his decades of research work) and creator of several revolutionary market analytical techniques and tools.
Mr. Harrison continues his market research & private client consultation and instructional work while living on the island of St. Croix in the US Virgin Islands.
Current market comments and archived articles may also be found on his website at www.wdgann-lost-secrets.com.
George may be contacted by e-mail at: george@money-tigers.com
![]()
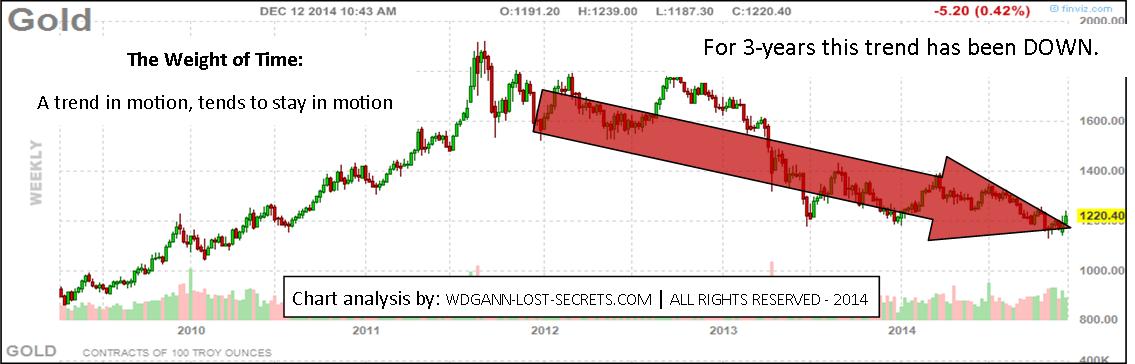
The Weight of Time as Trend
The Weight of Time as Trend
 We’ve all felt it. The ‘weight’ of time acting as Trends in the markets.
Trends that hold longer than expected and whose change in direction appears when we least expect or believe it.
Once time accumulates for an action and establishes a Trend, those trends take a lot of work to change.
It seems like the more time that passes after a task is done and energy has been spent, the harder it is to go back to revisit those tasks again.
It’s like getting motivated to mow the lawn after we’ve done it recently.
It’s easy to think about doing it again a day, 2 even 3-days after doing it, but, come a week or two later, and the ‘weight’ of time comes into the picture making the effort harder and harder to accomplish.
This is a natural function of Life AND Markets.
It takes an expenditure of energy to set things in motion and even more energy to alter or change that motion to another direction.
Markets too, once they’ve obtained the energy and motion (for a trend) tend to stay in that trend and energy flow.
An object (the Market) in motion (trending) tending to stay in Motion (in the same trend direction).
Let’s take a look at a popular market (Gold) to illustrate the point.
The chart below shows the still-continuing downward trend for Gold at present.
Gold prices have been in a declining trend for over 3-years now. Those 3-years have now accumulated a momentum of their own and ‘lent’ it to the market called ‘Gold’ and, that downtrend doesn’t want to alter it’s direction and is highly resistant to change at this point.
This principle is simply a law of Nature; one we shouldn’t fight. It takes a good deal of ‘energy’ or ‘money’ to alter a trend in motion.
The chart for GOLD above shows just such a trend in progress. In this case, Gold prices have been dropping for 3 years now.
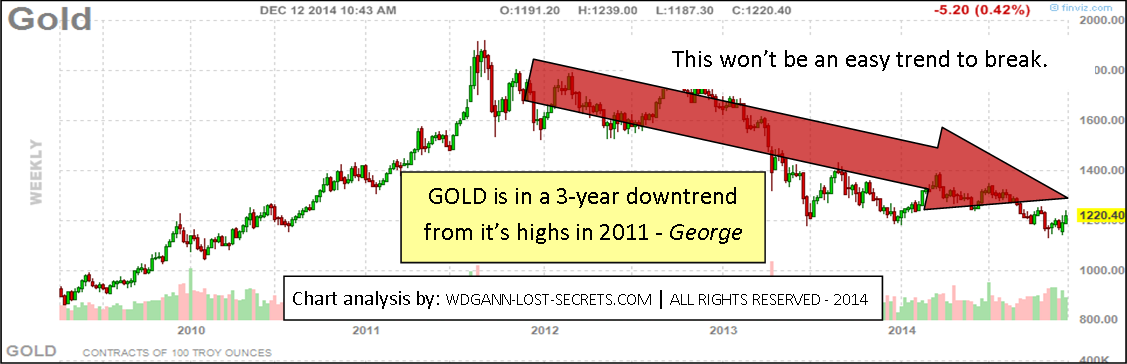
This is a solid trend with the strong Weight of Time behind it.
It will take a great deal of energy to turn this market around. Much like it takes a great deal of time and distance to turn around an oil tanker once it’s in motion and decides to change course. Energy (money, in this case and a great deal of it) will be required to effect the change everyone has been talking about for the last 3 years while waiting for this trend to change.
A MAJOR TREND SHIFT IN GOLD?
NOT YET. But, we’re now seeing the earliest signs of some energy input into changing the trend from downwards to up again. In other words, a gradual shift towards an upwards trend has begun.
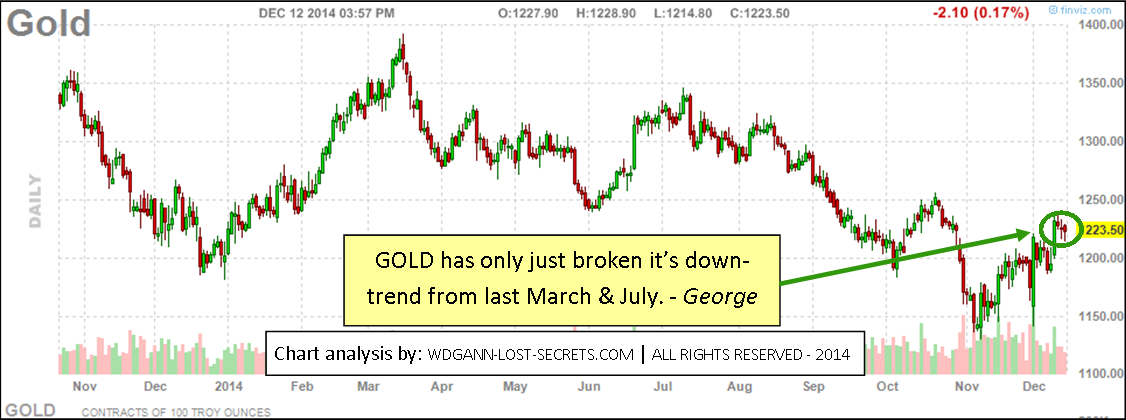
These are not at a 3-year level of trend momentum however.
The shorter downward trend periods of 6-months and 1-year have now been broken clearing the way to higher prices again.
But, these higher prices may be of short duration such as 3 to 6 months or less unless sufficient buying power comes into the market to lift prices above $1450/oz. within a month, or $1375/oz. in 6-months. Unless this happens we’re still stuck in a 3-Year downtrend that hasn’t quit yet.
A serious Bull market in Gold is not the way to bet until these price points are surpassed strongly.
In a deflationary world environment, rising prices for a commodity like Gold are pretty hard to justify or even hope for. However, ‘hope springs eternal’ in the minds of investors and traders.
I’ve written on this subject before from several different perspectives to illustrate the same fundamental laws.
When everyone has a ‘precious’ metal, it ceases to be ‘precious’ by definition. When practically everyone has something (like Gold or Silver) where is the demand going to come from to push prices higher? Anyone??
Instead of a trading plan built on wisps of hope (or hurricanes of hype), It’s far better to work within the natural cycles of trend momentum that markets and prices gravitate to in order to read the ‘signs’ that really matter.
What’s encouraged, in other words, is a Human approach to trading that works within the same rule base that the Markets must work within.
Something that gives the user a feeling of control and solid-ground to stand on because they KNOW that they’re using the very same laws that Nature uses to run the World.
There’s nothing as comforting as using analytical methods based on the Universe’s Billions of years of successful application of Natural Laws!
When we recognize that these laws of the Universe are the same laws that govern our lives and that we’re not, in any way, ‘outside’ this System, then we can voluntarily align ourselves with them and make better assessments of market conditions and timing for trading those markets.
Whether a king of manipulators or an everyday trader, we’re all playing in the same sandbox. The Sandbox (the Universe) frames and contains all our possible actions within it’s boundaries and no one can thwart it or escape the Rules of the Sandbox.
What about the massive market manipulation of our times? It turns out that this is nothing new historically and many have prospered during the many other times just like these.
Take comfort and look at it this way; At least the Laws of the Universe are Honest and Incorruptible in their equal application.
In fact, in today’s world, it’s now much safer (and more satisfying) to work within those Universal Rules in order to out-maneuver the man-made schemes and misinformation that are increasingly present in both the markets and their supporting media.
All change is difficult to both accept and act upon. Human Beings are often slow to respond, change their positions or their minds (that’s the Weight of Time coming into play). But, when the Master System that rules this Universe puts these changes of trend into effect, we have no choice but to both accept and act quickly and follow that new Trend. – George
© 2014 Copyright George R Harrison – All Rights Reserved
Disclaimer: All articles and posts are a matter of opinion (drawn from over 44-years of market research & experience) and are provided for general information purposes only and are not intended as investment advice. Information and analysis above are derived from sources and utilize privately discovered methods believed to be reliable, but we cannot accept responsibility for any losses you may incur as a result of this analysis. Individuals should consult with their personal financial advisers.
![]()

MORE ARTICLES ABOUT WD GANN:

- New: Gann’s Trading Rules
- Seasons of the Markets
- WD Gann’s Key to Better Market Timing
- WD Gann Lost Secrets Rediscovered
- WD Gann’s Data List Secrets
- The Wisdom of Solomon & ‘The Solomon Clue’
- WD GANN: Going Beyond Astrology
- Proper understanding and placement of WD Gann’s critical price angles.
- Secrets to WD Gann’s greatest public trade (1909 September Wheat)
- WD Gann’s Law of Vibration
- Gann’s Lost Swing Chart Technique; WD Gann’s Data List Secrets
- Many more unique WD Gann Articles: HERE.
- WD Gann’s personal hidden chart key
- Gann’s secret counting sequence to predict monthly turns
- Rediscovering the secrets to Gann’s vertical & horizontal angles
![]()
The rediscovery of these WD Gann lost secrets (and many more) as well as other completely original discoveries are available to a limited number of students each year through The Harrison-Gann Trade Secrets Master Course. Contact me by e-mail for price and availability by clicking the box below.
NOTE: This is the time of the year when I offer incredible savings to those students who wish to start the new year fresh using this extremely effective and limited-access market analysis information. Many wait all year for this opportunity!
A FUNDAMENTAL LAW OF THE UNIVERSE: You Must Take Action to Reach Your Goals. To Get the Best Deal, You Must Be Willing to Ask for the Best Deal.

![]()